Stock Analysis
- South Korea
- /
- Electrical
- /
- KOSDAQ:A065350
There's Been No Shortage Of Growth Recently For Shinsung Delta TechLtd's (KOSDAQ:065350) Returns On Capital


If you're looking for a multi-bagger, there's a few things to keep an eye out for. Ideally, a business will show two trends; firstly a growing return on capital employed (ROCE) and secondly, an increasing amount of capital employed. If you see this, it typically means it's a company with a great business model and plenty of profitable reinvestment opportunities. So on that note, Shinsung Delta TechLtd (KOSDAQ:065350) looks quite promising in regards to its trends of return on capital.
Return On Capital Employed (ROCE): What is it?
For those who don't know, ROCE is a measure of a company's yearly pre-tax profit (its return), relative to the capital employed in the business. Analysts use this formula to calculate it for Shinsung Delta TechLtd:
Return on Capital Employed = Earnings Before Interest and Tax (EBIT) ÷ (Total Assets - Current Liabilities)
0.067 = ₩13b ÷ (₩411b - ₩212b) (Based on the trailing twelve months to December 2020).
Therefore, Shinsung Delta TechLtd has an ROCE of 6.7%. Even though it's in line with the industry average of 6.8%, it's still a low return by itself.
Check out our latest analysis for Shinsung Delta TechLtd
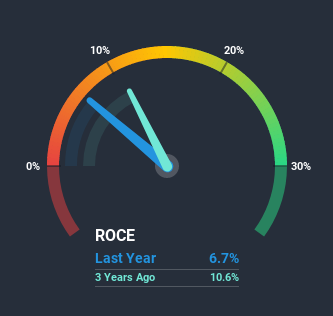
Historical performance is a great place to start when researching a stock so above you can see the gauge for Shinsung Delta TechLtd's ROCE against it's prior returns. If you're interested in investigating Shinsung Delta TechLtd's past further, check out this free graph of past earnings, revenue and cash flow.
What Does the ROCE Trend For Shinsung Delta TechLtd Tell Us?
While in absolute terms it isn't a high ROCE, it's promising to see that it has been moving in the right direction. Over the last five years, returns on capital employed have risen substantially to 6.7%. Basically the business is earning more per dollar of capital invested and in addition to that, 20% more capital is being employed now too. This can indicate that there's plenty of opportunities to invest capital internally and at ever higher rates, a combination that's common among multi-baggers.
Another thing to note, Shinsung Delta TechLtd has a high ratio of current liabilities to total assets of 52%. This effectively means that suppliers (or short-term creditors) are funding a large portion of the business, so just be aware that this can introduce some elements of risk. While it's not necessarily a bad thing, it can be beneficial if this ratio is lower.
The Bottom Line On Shinsung Delta TechLtd's ROCE
A company that is growing its returns on capital and can consistently reinvest in itself is a highly sought after trait, and that's what Shinsung Delta TechLtd has. And a remarkable 183% total return over the last five years tells us that investors are expecting more good things to come in the future. So given the stock has proven it has promising trends, it's worth researching the company further to see if these trends are likely to persist.
One final note, you should learn about the 2 warning signs we've spotted with Shinsung Delta TechLtd (including 1 which is concerning) .
While Shinsung Delta TechLtd may not currently earn the highest returns, we've compiled a list of companies that currently earn more than 25% return on equity. Check out this free list here.
When trading Shinsung Delta TechLtd or any other investment, use the platform considered by many to be the Professional's Gateway to the Worlds Market, Interactive Brokers. You get the lowest-cost* trading on stocks, options, futures, forex, bonds and funds worldwide from a single integrated account. Promoted
Valuation is complex, but we're helping make it simple.
Find out whether Shinsung Delta TechLtd is potentially over or undervalued by checking out our comprehensive analysis, which includes fair value estimates, risks and warnings, dividends, insider transactions and financial health.
View the Free AnalysisThis article by Simply Wall St is general in nature. It does not constitute a recommendation to buy or sell any stock, and does not take account of your objectives, or your financial situation. We aim to bring you long-term focused analysis driven by fundamental data. Note that our analysis may not factor in the latest price-sensitive company announcements or qualitative material. Simply Wall St has no position in any stocks mentioned.
*Interactive Brokers Rated Lowest Cost Broker by StockBrokers.com Annual Online Review 2020
Have feedback on this article? Concerned about the content? Get in touch with us directly. Alternatively, email editorial-team (at) simplywallst.com.
About KOSDAQ:A065350
Shinsung Delta TechLtd
Produces and sells various home appliance, automotive, IT, and B2C products in South Korea and internationally.
Mediocre balance sheet with questionable track record.
