
Advertisement
- South Korea
- /
- Electrical
- /
- KOSDAQ:A065350
Are Shinsung Delta Tech Co.,Ltd.'s (KOSDAQ:065350) Fundamentals Good Enough to Warrant Buying Given The Stock's Recent Weakness?

Shinsung Delta TechLtd (KOSDAQ:065350) has had a rough three months with its share price down 24%. However, the company's fundamentals look pretty decent, and long-term financials are usually aligned with future market price movements. Particularly, we will be paying attention to Shinsung Delta TechLtd's ROE today.
Return on equity or ROE is an important factor to be considered by a shareholder because it tells them how effectively their capital is being reinvested. Put another way, it reveals the company's success at turning shareholder investments into profits.
Check out our latest analysis for Shinsung Delta TechLtd
How Is ROE Calculated?
The formula for return on equity is:
Return on Equity = Net Profit (from continuing operations) ÷ Shareholders' Equity
So, based on the above formula, the ROE for Shinsung Delta TechLtd is:
5.0% = ₩15b ÷ ₩310b (Based on the trailing twelve months to March 2024).
The 'return' is the amount earned after tax over the last twelve months. Another way to think of that is that for every ₩1 worth of equity, the company was able to earn ₩0.05 in profit.
Why Is ROE Important For Earnings Growth?
So far, we've learned that ROE is a measure of a company's profitability. Based on how much of its profits the company chooses to reinvest or "retain", we are then able to evaluate a company's future ability to generate profits. Generally speaking, other things being equal, firms with a high return on equity and profit retention, have a higher growth rate than firms that don’t share these attributes.
Shinsung Delta TechLtd's Earnings Growth And 5.0% ROE
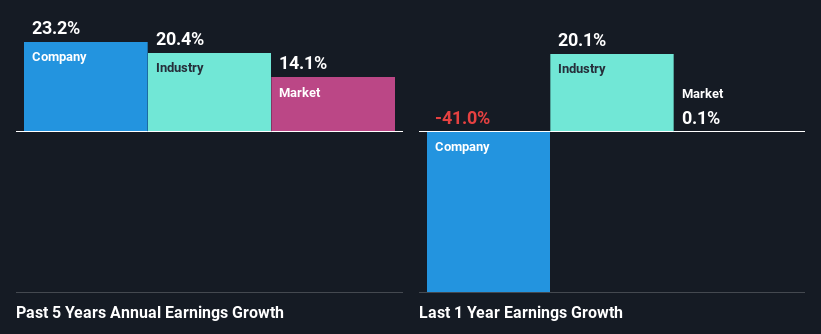
On the face of it, Shinsung Delta TechLtd's ROE is not much to talk about. Next, when compared to the average industry ROE of 7.8%, the company's ROE leaves us feeling even less enthusiastic. However, we we're pleasantly surprised to see that Shinsung Delta TechLtd grew its net income at a significant rate of 23% in the last five years. Therefore, there could be other reasons behind this growth. Such as - high earnings retention or an efficient management in place.
We then performed a comparison between Shinsung Delta TechLtd's net income growth with the industry, which revealed that the company's growth is similar to the average industry growth of 20% in the same 5-year period.
Earnings growth is a huge factor in stock valuation. What investors need to determine next is if the expected earnings growth, or the lack of it, is already built into the share price. Doing so will help them establish if the stock's future looks promising or ominous. Is Shinsung Delta TechLtd fairly valued compared to other companies? These 3 valuation measures might help you decide.
Is Shinsung Delta TechLtd Making Efficient Use Of Its Profits?
The three-year median payout ratio for Shinsung Delta TechLtd is 30%, which is moderately low. The company is retaining the remaining 70%. This suggests that its dividend is well covered, and given the high growth we discussed above, it looks like Shinsung Delta TechLtd is reinvesting its earnings efficiently.
Additionally, Shinsung Delta TechLtd has paid dividends over a period of five years which means that the company is pretty serious about sharing its profits with shareholders.
Conclusion
In total, it does look like Shinsung Delta TechLtd has some positive aspects to its business. With a high rate of reinvestment, albeit at a low ROE, the company has managed to see a considerable growth in its earnings. While we won't completely dismiss the company, what we would do, is try to ascertain how risky the business is to make a more informed decision around the company. You can see the 3 risks we have identified for Shinsung Delta TechLtd by visiting our risks dashboard for free on our platform here.
New: Manage All Your Stock Portfolios in One Place
We've created the ultimate portfolio companion for stock investors, and it's free.
• Connect an unlimited number of Portfolios and see your total in one currency
• Be alerted to new Warning Signs or Risks via email or mobile
• Track the Fair Value of your stocks
Have feedback on this article? Concerned about the content? Get in touch with us directly. Alternatively, email editorial-team (at) simplywallst.com.
This article by Simply Wall St is general in nature. We provide commentary based on historical data and analyst forecasts only using an unbiased methodology and our articles are not intended to be financial advice. It does not constitute a recommendation to buy or sell any stock, and does not take account of your objectives, or your financial situation. We aim to bring you long-term focused analysis driven by fundamental data. Note that our analysis may not factor in the latest price-sensitive company announcements or qualitative material. Simply Wall St has no position in any stocks mentioned.
About KOSDAQ:A065350
Shinsung Delta TechLtd
Produces and sells various home appliance, automotive, IT, and B2C products in South Korea and internationally.
Mediocre balance sheet low.
Market Insights


Advertisement
Community Narratives
MicroStrategy: Volatile Gamble or Golden Opportunity?
Fair Value US$663.00|33.3% undervalued
BL
Community Contributor
Emerging Markets and Debt Reduction Will Propel Bath & Body Works Forward
Fair Value US$40.73|23.4% undervalued
ZW
Community Contributor
An amazing opportunity to potentially get a 100 bagger
Fair Value US$10.00|8.5% overvalued
DA
Community Contributor