
Advertisement
- South Korea
- /
- Building
- /
- KOSDAQ:A039020
Subdued Growth No Barrier To Eagon Holdings Co.,Ltd (KOSDAQ:039020) With Shares Advancing 26%

Eagon Holdings Co.,Ltd (KOSDAQ:039020) shares have had a really impressive month, gaining 26% after a shaky period beforehand. Looking back a bit further, it's encouraging to see the stock is up 82% in the last year.
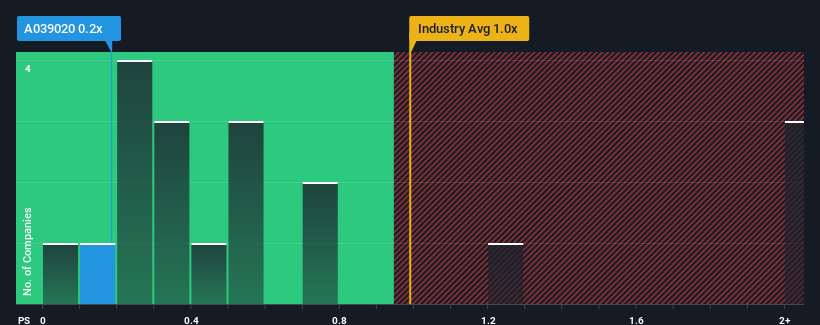
In spite of the firm bounce in price, you could still be forgiven for feeling indifferent about Eagon HoldingsLtd's P/S ratio of 0.2x, since the median price-to-sales (or "P/S") ratio for the Building industry in Korea is also close to 0.4x. Although, it's not wise to simply ignore the P/S without explanation as investors may be disregarding a distinct opportunity or a costly mistake.
We've discovered 3 warning signs about Eagon HoldingsLtd. View them for free.See our latest analysis for Eagon HoldingsLtd
What Does Eagon HoldingsLtd's P/S Mean For Shareholders?
Revenue has risen firmly for Eagon HoldingsLtd recently, which is pleasing to see. One possibility is that the P/S is moderate because investors think this respectable revenue growth might not be enough to outperform the broader industry in the near future. If you like the company, you'd be hoping this isn't the case so that you could potentially pick up some stock while it's not quite in favour.
Want the full picture on earnings, revenue and cash flow for the company? Then our free report on Eagon HoldingsLtd will help you shine a light on its historical performance.How Is Eagon HoldingsLtd's Revenue Growth Trending?
The only time you'd be comfortable seeing a P/S like Eagon HoldingsLtd's is when the company's growth is tracking the industry closely.
Retrospectively, the last year delivered a decent 8.5% gain to the company's revenues. However, due to its less than impressive performance prior to this period, revenue growth is practically non-existent over the last three years overall. Therefore, it's fair to say that revenue growth has been inconsistent recently for the company.
This is in contrast to the rest of the industry, which is expected to grow by 7.5% over the next year, materially higher than the company's recent medium-term annualised growth rates.
With this information, we find it interesting that Eagon HoldingsLtd is trading at a fairly similar P/S compared to the industry. Apparently many investors in the company are less bearish than recent times would indicate and aren't willing to let go of their stock right now. They may be setting themselves up for future disappointment if the P/S falls to levels more in line with recent growth rates.
The Bottom Line On Eagon HoldingsLtd's P/S
Eagon HoldingsLtd appears to be back in favour with a solid price jump bringing its P/S back in line with other companies in the industry Generally, our preference is to limit the use of the price-to-sales ratio to establishing what the market thinks about the overall health of a company.
Our examination of Eagon HoldingsLtd revealed its poor three-year revenue trends aren't resulting in a lower P/S as per our expectations, given they look worse than current industry outlook. When we see weak revenue with slower than industry growth, we suspect the share price is at risk of declining, bringing the P/S back in line with expectations. Unless the recent medium-term conditions improve, it's hard to accept the current share price as fair value.
Before you settle on your opinion, we've discovered 3 warning signs for Eagon HoldingsLtd (2 are a bit unpleasant!) that you should be aware of.
If companies with solid past earnings growth is up your alley, you may wish to see this free collection of other companies with strong earnings growth and low P/E ratios.
Valuation is complex, but we're here to simplify it.
Discover if Eagon HoldingsLtd might be undervalued or overvalued with our detailed analysis, featuring fair value estimates, potential risks, dividends, insider trades, and its financial condition.
Access Free AnalysisHave feedback on this article? Concerned about the content? Get in touch with us directly. Alternatively, email editorial-team (at) simplywallst.com.
This article by Simply Wall St is general in nature. We provide commentary based on historical data and analyst forecasts only using an unbiased methodology and our articles are not intended to be financial advice. It does not constitute a recommendation to buy or sell any stock, and does not take account of your objectives, or your financial situation. We aim to bring you long-term focused analysis driven by fundamental data. Note that our analysis may not factor in the latest price-sensitive company announcements or qualitative material. Simply Wall St has no position in any stocks mentioned.
About KOSDAQ:A039020
Eagon HoldingsLtd
Produces and sells building materials in South Korea and internationally.
Low and slightly overvalued.
Market Insights

Advertisement
Community Narratives
WhiteCap Is Positioned To Profit Regardless Of Trump's Policy 
Fair Value CA$22.60|61.6% undervalued
ST
Equity Analyst and Writer
Microsoft's Evolution Will Drive Revenue to New Heights Fueled by AI
Fair Value US$360.00|29.9% overvalued
BR
Community Contributor
A CASE FOR USD$2.50 (CAD$3.44) BY 2028 (A 5-10 BAGGER)
Fair Value CA$3.44|87.8% undervalued
AG
Community Contributor