
Advertisement
- South Korea
- /
- Machinery
- /
- KOSDAQ:A007530
Is Youngsin Metal Industrial (KOSDAQ:007530) Using Too Much Debt?

Legendary fund manager Li Lu (who Charlie Munger backed) once said, 'The biggest investment risk is not the volatility of prices, but whether you will suffer a permanent loss of capital.' So it seems the smart money knows that debt - which is usually involved in bankruptcies - is a very important factor, when you assess how risky a company is. We note that Youngsin Metal Industrial Co., Ltd. (KOSDAQ:007530) does have debt on its balance sheet. But is this debt a concern to shareholders?
What Risk Does Debt Bring?
Debt assists a business until the business has trouble paying it off, either with new capital or with free cash flow. In the worst case scenario, a company can go bankrupt if it cannot pay its creditors. However, a more common (but still painful) scenario is that it has to raise new equity capital at a low price, thus permanently diluting shareholders. By replacing dilution, though, debt can be an extremely good tool for businesses that need capital to invest in growth at high rates of return. The first step when considering a company's debt levels is to consider its cash and debt together.
What Is Youngsin Metal Industrial's Net Debt?
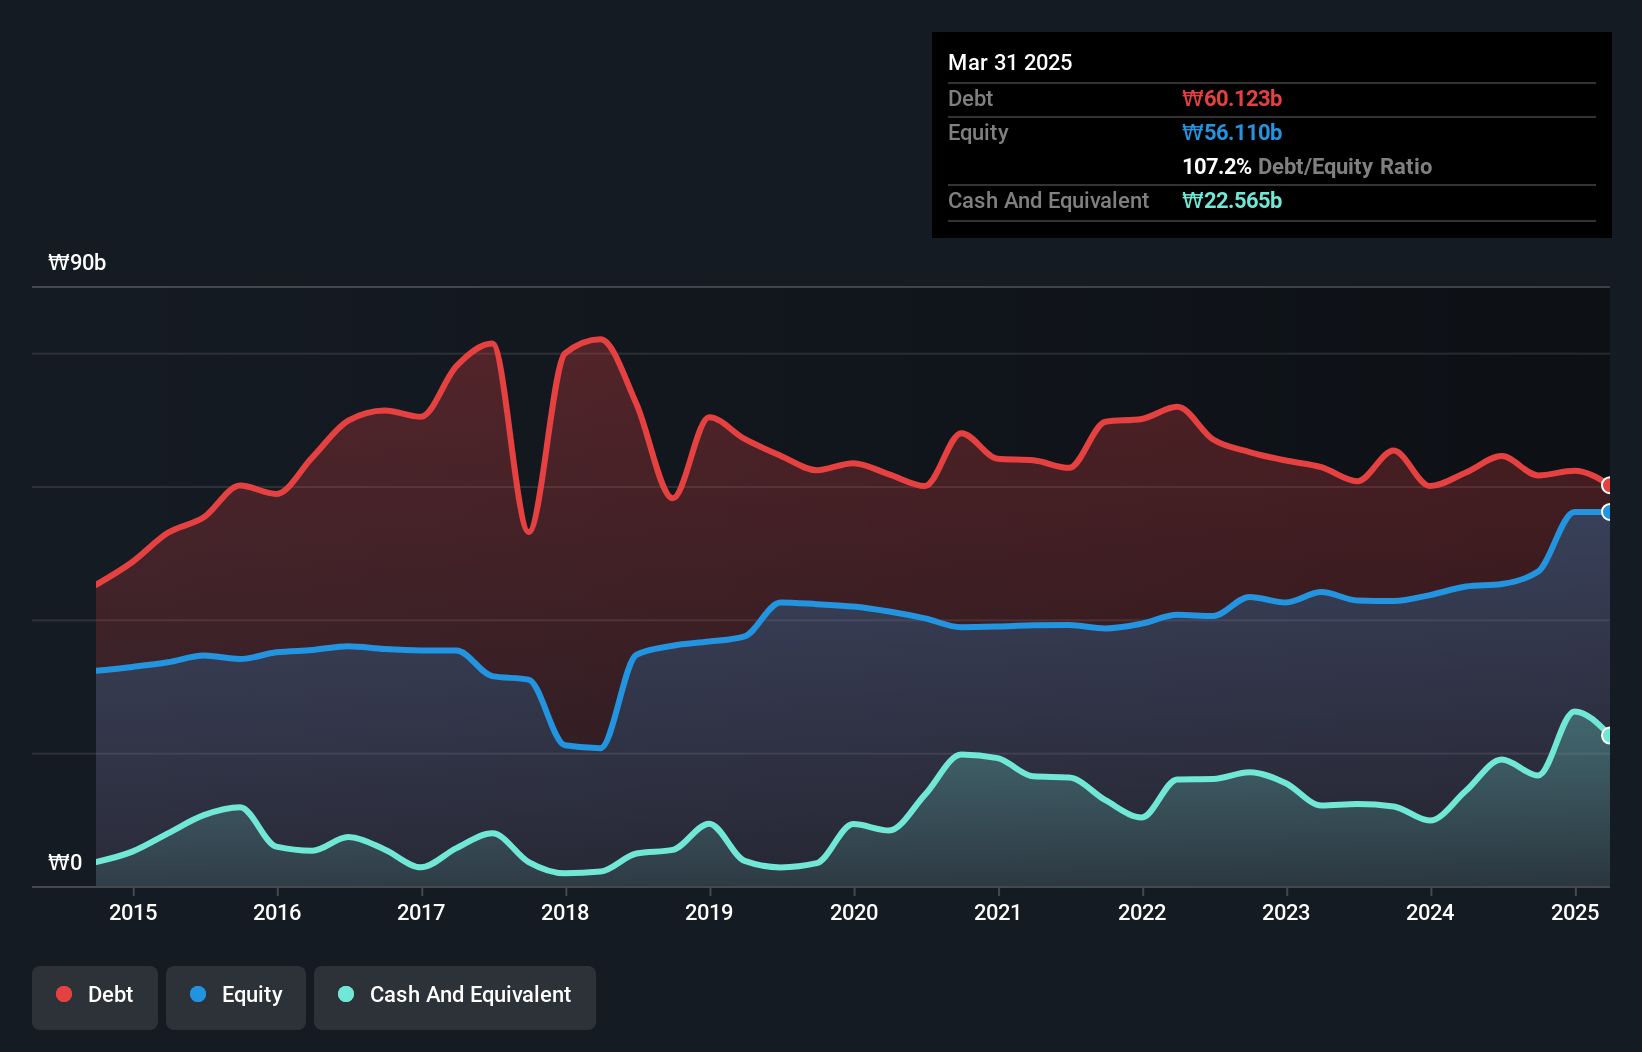
The chart below, which you can click on for greater detail, shows that Youngsin Metal Industrial had ₩60.1b in debt in March 2025; about the same as the year before. However, it does have ₩22.6b in cash offsetting this, leading to net debt of about ₩37.6b.
How Healthy Is Youngsin Metal Industrial's Balance Sheet?
Zooming in on the latest balance sheet data, we can see that Youngsin Metal Industrial had liabilities of ₩83.6b due within 12 months and liabilities of ₩14.5b due beyond that. Offsetting this, it had ₩22.6b in cash and ₩26.8b in receivables that were due within 12 months. So its liabilities outweigh the sum of its cash and (near-term) receivables by ₩48.7b.
This deficit is considerable relative to its market capitalization of ₩55.9b, so it does suggest shareholders should keep an eye on Youngsin Metal Industrial's use of debt. Should its lenders demand that it shore up the balance sheet, shareholders would likely face severe dilution.
View our latest analysis for Youngsin Metal Industrial
We use two main ratios to inform us about debt levels relative to earnings. The first is net debt divided by earnings before interest, tax, depreciation, and amortization (EBITDA), while the second is how many times its earnings before interest and tax (EBIT) covers its interest expense (or its interest cover, for short). This way, we consider both the absolute quantum of the debt, as well as the interest rates paid on it.
While Youngsin Metal Industrial's debt to EBITDA ratio (3.7) suggests that it uses some debt, its interest cover is very weak, at 1.4, suggesting high leverage. It seems that the business incurs large depreciation and amortisation charges, so maybe its debt load is heavier than it would first appear, since EBITDA is arguably a generous measure of earnings. It seems clear that the cost of borrowing money is negatively impacting returns for shareholders, of late. Another concern for investors might be that Youngsin Metal Industrial's EBIT fell 18% in the last year. If that's the way things keep going handling the debt load will be like delivering hot coffees on a pogo stick. There's no doubt that we learn most about debt from the balance sheet. But you can't view debt in total isolation; since Youngsin Metal Industrial will need earnings to service that debt. So when considering debt, it's definitely worth looking at the earnings trend. Click here for an interactive snapshot.
But our final consideration is also important, because a company cannot pay debt with paper profits; it needs cold hard cash. So we clearly need to look at whether that EBIT is leading to corresponding free cash flow. Over the last three years, Youngsin Metal Industrial recorded free cash flow worth a fulsome 81% of its EBIT, which is stronger than we'd usually expect. That positions it well to pay down debt if desirable to do so.
Our View
To be frank both Youngsin Metal Industrial's EBIT growth rate and its track record of covering its interest expense with its EBIT make us rather uncomfortable with its debt levels. But at least it's pretty decent at converting EBIT to free cash flow; that's encouraging. Once we consider all the factors above, together, it seems to us that Youngsin Metal Industrial's debt is making it a bit risky. Some people like that sort of risk, but we're mindful of the potential pitfalls, so we'd probably prefer it carry less debt. There's no doubt that we learn most about debt from the balance sheet. But ultimately, every company can contain risks that exist outside of the balance sheet. For example Youngsin Metal Industrial has 3 warning signs (and 1 which doesn't sit too well with us) we think you should know about.
Of course, if you're the type of investor who prefers buying stocks without the burden of debt, then don't hesitate to discover our exclusive list of net cash growth stocks, today.
New: Manage All Your Stock Portfolios in One Place
We've created the ultimate portfolio companion for stock investors, and it's free.
• Connect an unlimited number of Portfolios and see your total in one currency
• Be alerted to new Warning Signs or Risks via email or mobile
• Track the Fair Value of your stocks
Have feedback on this article? Concerned about the content? Get in touch with us directly. Alternatively, email editorial-team (at) simplywallst.com.
This article by Simply Wall St is general in nature. We provide commentary based on historical data and analyst forecasts only using an unbiased methodology and our articles are not intended to be financial advice. It does not constitute a recommendation to buy or sell any stock, and does not take account of your objectives, or your financial situation. We aim to bring you long-term focused analysis driven by fundamental data. Note that our analysis may not factor in the latest price-sensitive company announcements or qualitative material. Simply Wall St has no position in any stocks mentioned.
About KOSDAQ:A007530
Youngsin Metal Industrial
Manufactures and sells fasteners in South Korea and internationally.
Solid track record second-rate dividend payer.
Market Insights


Advertisement
Community Narratives
Alphabet: The Under-appreciated Compounder Hiding in Plain Sight
Fair Value US$282.83|30.2% undervalued
BL
Community Contributor
Planet Labs: At The Heart Of The Emerging New Space Boom
Fair Value US$11.31|44.5% undervalued
AN
Community Contributor
Exxon in Guyana 5 year forecast Low $135 to High $189
Fair Value US$189.00|40.8% undervalued
AG
Community Contributor