
Advertisement
Some say volatility, rather than debt, is the best way to think about risk as an investor, but Warren Buffett famously said that 'Volatility is far from synonymous with risk.' It's only natural to consider a company's balance sheet when you examine how risky it is, since debt is often involved when a business collapses. We note that DUAL Co., Ltd. (KRX:016740) does have debt on its balance sheet. But is this debt a concern to shareholders?
What Risk Does Debt Bring?
Debt assists a business until the business has trouble paying it off, either with new capital or with free cash flow. In the worst case scenario, a company can go bankrupt if it cannot pay its creditors. However, a more usual (but still expensive) situation is where a company must dilute shareholders at a cheap share price simply to get debt under control. Of course, the upside of debt is that it often represents cheap capital, especially when it replaces dilution in a company with the ability to reinvest at high rates of return. The first step when considering a company's debt levels is to consider its cash and debt together.
View our latest analysis for DUAL
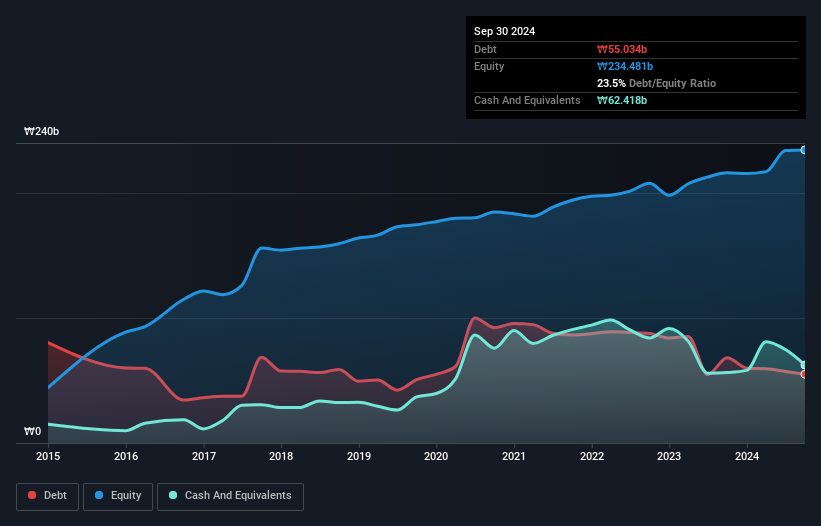
How Much Debt Does DUAL Carry?
As you can see below, DUAL had ₩55.0b of debt at September 2024, down from ₩68.2b a year prior. But it also has ₩62.4b in cash to offset that, meaning it has ₩7.38b net cash.
How Healthy Is DUAL's Balance Sheet?
We can see from the most recent balance sheet that DUAL had liabilities of ₩200.3b falling due within a year, and liabilities of ₩61.7b due beyond that. Offsetting these obligations, it had cash of ₩62.4b as well as receivables valued at ₩138.3b due within 12 months. So its liabilities total ₩61.3b more than the combination of its cash and short-term receivables.
This deficit is considerable relative to its market capitalization of ₩95.8b, so it does suggest shareholders should keep an eye on DUAL's use of debt. This suggests shareholders would be heavily diluted if the company needed to shore up its balance sheet in a hurry. While it does have liabilities worth noting, DUAL also has more cash than debt, so we're pretty confident it can manage its debt safely.
Another good sign is that DUAL has been able to increase its EBIT by 25% in twelve months, making it easier to pay down debt. There's no doubt that we learn most about debt from the balance sheet. But it is DUAL's earnings that will influence how the balance sheet holds up in the future. So if you're keen to discover more about its earnings, it might be worth checking out this graph of its long term earnings trend.
Finally, a business needs free cash flow to pay off debt; accounting profits just don't cut it. While DUAL has net cash on its balance sheet, it's still worth taking a look at its ability to convert earnings before interest and tax (EBIT) to free cash flow, to help us understand how quickly it is building (or eroding) that cash balance. Looking at the most recent three years, DUAL recorded free cash flow of 31% of its EBIT, which is weaker than we'd expect. That weak cash conversion makes it more difficult to handle indebtedness.
Summing Up
While DUAL does have more liabilities than liquid assets, it also has net cash of ₩7.38b. And it impressed us with its EBIT growth of 25% over the last year. So we don't have any problem with DUAL's use of debt. When analysing debt levels, the balance sheet is the obvious place to start. But ultimately, every company can contain risks that exist outside of the balance sheet. We've identified 1 warning sign with DUAL , and understanding them should be part of your investment process.
At the end of the day, it's often better to focus on companies that are free from net debt. You can access our special list of such companies (all with a track record of profit growth). It's free.
New: Manage All Your Stock Portfolios in One Place
We've created the ultimate portfolio companion for stock investors, and it's free.
• Connect an unlimited number of Portfolios and see your total in one currency
• Be alerted to new Warning Signs or Risks via email or mobile
• Track the Fair Value of your stocks
Have feedback on this article? Concerned about the content? Get in touch with us directly. Alternatively, email editorial-team (at) simplywallst.com.
This article by Simply Wall St is general in nature. We provide commentary based on historical data and analyst forecasts only using an unbiased methodology and our articles are not intended to be financial advice. It does not constitute a recommendation to buy or sell any stock, and does not take account of your objectives, or your financial situation. We aim to bring you long-term focused analysis driven by fundamental data. Note that our analysis may not factor in the latest price-sensitive company announcements or qualitative material. Simply Wall St has no position in any stocks mentioned.
About KOSE:A016740
DUAL
Manufactures and sells automobile interior materials in South Korea, China, Europe, and the United States.
Flawless balance sheet with solid track record.
Market Insights

Advertisement
Community Narratives
MicroVision will explode future revenue by 380.37% with a vision towards success
Fair Value US$60.00|98.4% undervalued
TH
Community Contributor
The Indispensable Artery for a New North American Economy
Fair Value CA$132.87|1.3% undervalued
TI
Community Contributor