
Advertisement
Legendary fund manager Li Lu (who Charlie Munger backed) once said, 'The biggest investment risk is not the volatility of prices, but whether you will suffer a permanent loss of capital.' So it might be obvious that you need to consider debt, when you think about how risky any given stock is, because too much debt can sink a company. We note that Hyundai Mobis Co.,Ltd (KRX:012330) does have debt on its balance sheet. But the real question is whether this debt is making the company risky.
What Risk Does Debt Bring?
Debt is a tool to help businesses grow, but if a business is incapable of paying off its lenders, then it exists at their mercy. If things get really bad, the lenders can take control of the business. However, a more usual (but still expensive) situation is where a company must dilute shareholders at a cheap share price simply to get debt under control. By replacing dilution, though, debt can be an extremely good tool for businesses that need capital to invest in growth at high rates of return. The first thing to do when considering how much debt a business uses is to look at its cash and debt together.
What Is Hyundai MobisLtd's Debt?
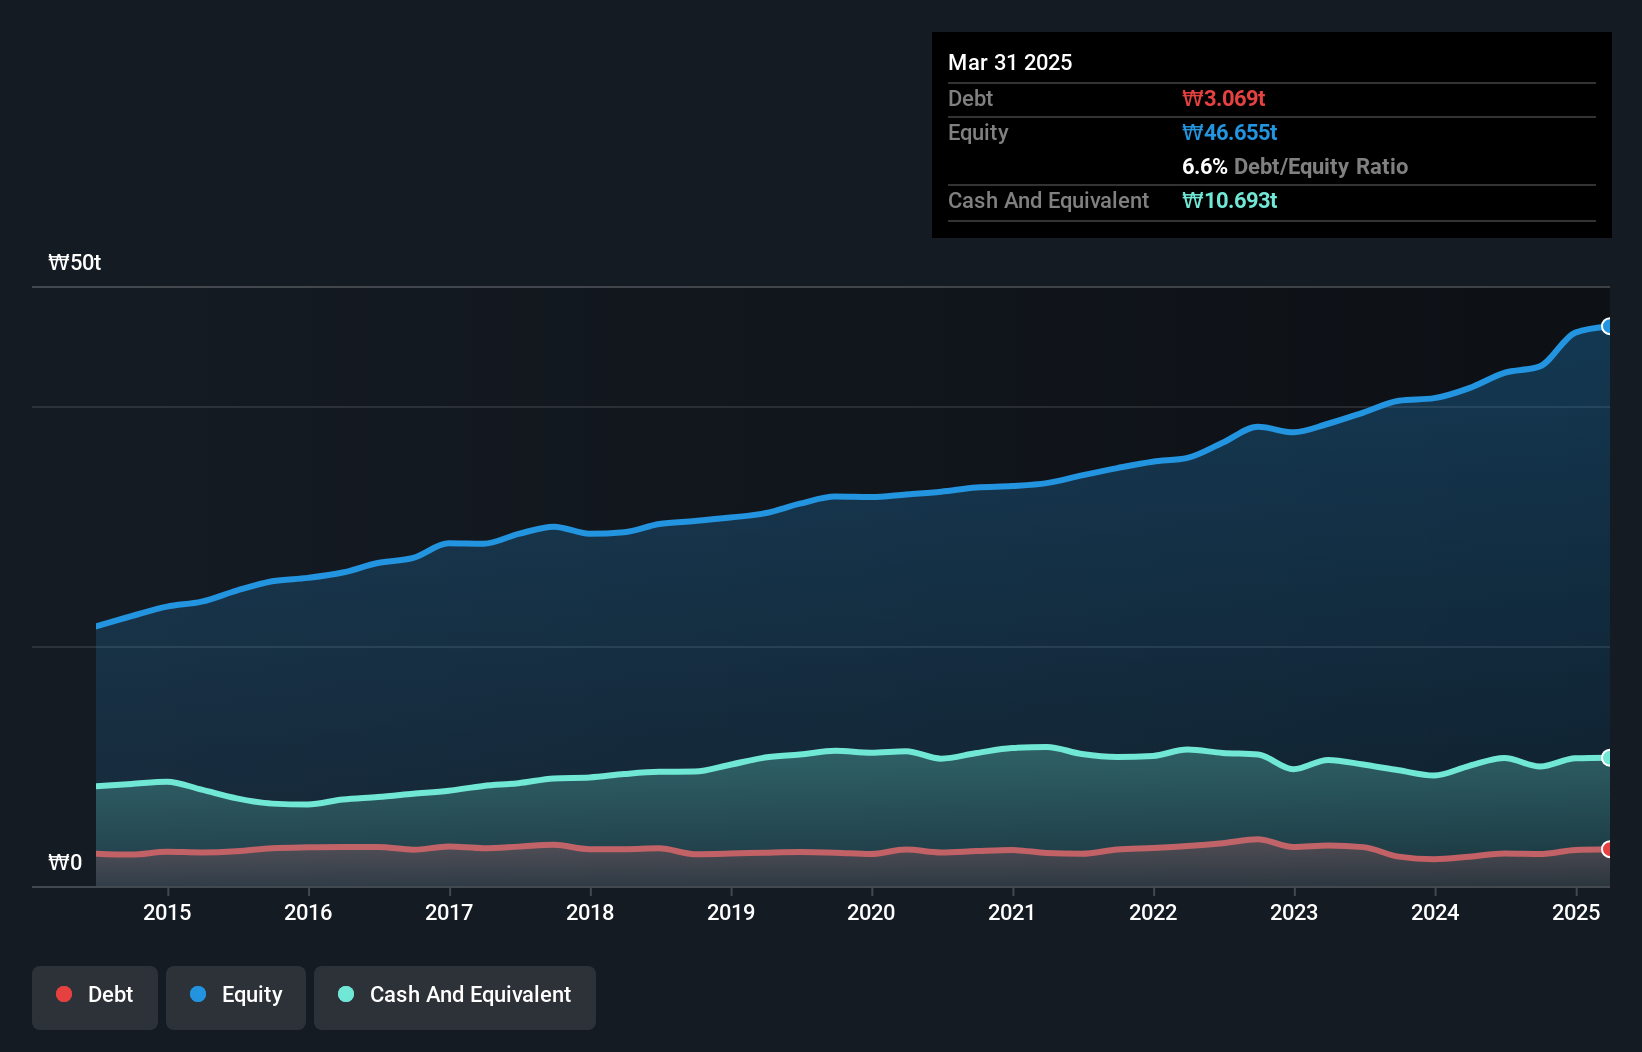
As you can see below, at the end of March 2025, Hyundai MobisLtd had ₩3.07t of debt, up from ₩2.44t a year ago. Click the image for more detail. But on the other hand it also has ₩11t in cash, leading to a ₩7.62t net cash position.
A Look At Hyundai MobisLtd's Liabilities
Zooming in on the latest balance sheet data, we can see that Hyundai MobisLtd had liabilities of ₩14t due within 12 months and liabilities of ₩8.01t due beyond that. Offsetting these obligations, it had cash of ₩11t as well as receivables valued at ₩12t due within 12 months. So it can boast ₩580.7b more liquid assets than total liabilities.
This short term liquidity is a sign that Hyundai MobisLtd could probably pay off its debt with ease, as its balance sheet is far from stretched. Succinctly put, Hyundai MobisLtd boasts net cash, so it's fair to say it does not have a heavy debt load!
See our latest analysis for Hyundai MobisLtd
In addition to that, we're happy to report that Hyundai MobisLtd has boosted its EBIT by 37%, thus reducing the spectre of future debt repayments. When analysing debt levels, the balance sheet is the obvious place to start. But ultimately the future profitability of the business will decide if Hyundai MobisLtd can strengthen its balance sheet over time. So if you're focused on the future you can check out this free report showing analyst profit forecasts.
Finally, a business needs free cash flow to pay off debt; accounting profits just don't cut it. While Hyundai MobisLtd has net cash on its balance sheet, it's still worth taking a look at its ability to convert earnings before interest and tax (EBIT) to free cash flow, to help us understand how quickly it is building (or eroding) that cash balance. During the last three years, Hyundai MobisLtd produced sturdy free cash flow equating to 78% of its EBIT, about what we'd expect. This cold hard cash means it can reduce its debt when it wants to.
Summing Up
While we empathize with investors who find debt concerning, you should keep in mind that Hyundai MobisLtd has net cash of ₩7.62t, as well as more liquid assets than liabilities. And we liked the look of last year's 37% year-on-year EBIT growth. So we don't think Hyundai MobisLtd's use of debt is risky. Over time, share prices tend to follow earnings per share, so if you're interested in Hyundai MobisLtd, you may well want to click here to check an interactive graph of its earnings per share history.
If you're interested in investing in businesses that can grow profits without the burden of debt, then check out this free list of growing businesses that have net cash on the balance sheet.
Valuation is complex, but we're here to simplify it.
Discover if Hyundai MobisLtd might be undervalued or overvalued with our detailed analysis, featuring fair value estimates, potential risks, dividends, insider trades, and its financial condition.
Access Free AnalysisHave feedback on this article? Concerned about the content? Get in touch with us directly. Alternatively, email editorial-team (at) simplywallst.com.
This article by Simply Wall St is general in nature. We provide commentary based on historical data and analyst forecasts only using an unbiased methodology and our articles are not intended to be financial advice. It does not constitute a recommendation to buy or sell any stock, and does not take account of your objectives, or your financial situation. We aim to bring you long-term focused analysis driven by fundamental data. Note that our analysis may not factor in the latest price-sensitive company announcements or qualitative material. Simply Wall St has no position in any stocks mentioned.
About KOSE:A012330
Hyundai MobisLtd
Engages in the auto parts business in Korea, China, the United States, Europe, and internationally.
Very undervalued with flawless balance sheet.
Similar Companies
Market Insights

Advertisement
Community Narratives
MINISO's fair value is projected at 26.69 with an anticipated PE ratio shift of 20x
Fair Value US$24.03|11.0% undervalued
BE
Community Contributor
Procter & Gamble: A Dividend Giant Facing Slowing Growth
Fair Value US$119.81|23.3% overvalued
AN
Community Contributor
Eli Lilly's Future Growth Driven by Tirzepatide and Favorable Market Conditions
Fair Value US$1.19k|13.8% undervalued
EA
Community Contributor