
Advertisement
- South Korea
- /
- Auto Components
- /
- KOSDAQ:A024840
Kbi Metal Co., Ltd. (KOSDAQ:024840) Stock Rockets 52% But Many Are Still Ignoring The Company
Kbi Metal Co., Ltd. (KOSDAQ:024840) shareholders have had their patience rewarded with a 52% share price jump in the last month. Looking further back, the 25% rise over the last twelve months isn't too bad notwithstanding the strength over the last 30 days.
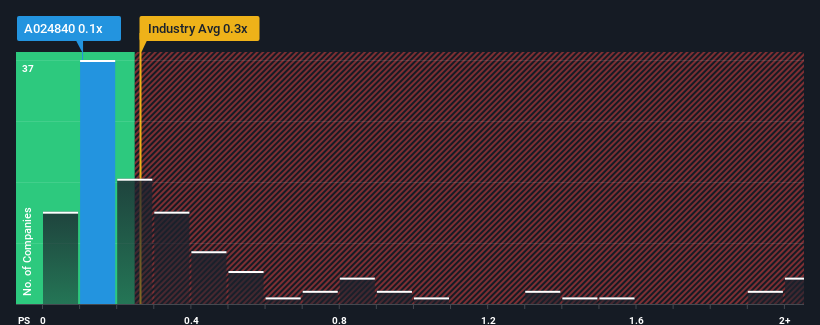
Even after such a large jump in price, it's still not a stretch to say that Kbi Metal's price-to-sales (or "P/S") ratio of 0.1x right now seems quite "middle-of-the-road" compared to the Auto Components industry in Korea, where the median P/S ratio is around 0.3x. While this might not raise any eyebrows, if the P/S ratio is not justified investors could be missing out on a potential opportunity or ignoring looming disappointment.
See our latest analysis for Kbi Metal
What Does Kbi Metal's P/S Mean For Shareholders?
For instance, Kbi Metal's receding revenue in recent times would have to be some food for thought. It might be that many expect the company to put the disappointing revenue performance behind them over the coming period, which has kept the P/S from falling. If you like the company, you'd at least be hoping this is the case so that you could potentially pick up some stock while it's not quite in favour.
Although there are no analyst estimates available for Kbi Metal, take a look at this free data-rich visualisation to see how the company stacks up on earnings, revenue and cash flow.Is There Some Revenue Growth Forecasted For Kbi Metal?
There's an inherent assumption that a company should be matching the industry for P/S ratios like Kbi Metal's to be considered reasonable.
In reviewing the last year of financials, we were disheartened to see the company's revenues fell to the tune of 3.6%. Even so, admirably revenue has lifted 39% in aggregate from three years ago, notwithstanding the last 12 months. Although it's been a bumpy ride, it's still fair to say the revenue growth recently has been more than adequate for the company.
Comparing that to the industry, which is only predicted to deliver 5.3% growth in the next 12 months, the company's momentum is stronger based on recent medium-term annualised revenue results.
With this information, we find it interesting that Kbi Metal is trading at a fairly similar P/S compared to the industry. Apparently some shareholders believe the recent performance is at its limits and have been accepting lower selling prices.
What We Can Learn From Kbi Metal's P/S?
Kbi Metal's stock has a lot of momentum behind it lately, which has brought its P/S level with the rest of the industry. Typically, we'd caution against reading too much into price-to-sales ratios when settling on investment decisions, though it can reveal plenty about what other market participants think about the company.
We've established that Kbi Metal currently trades on a lower than expected P/S since its recent three-year growth is higher than the wider industry forecast. When we see strong revenue with faster-than-industry growth, we can only assume potential risks are what might be placing pressure on the P/S ratio. It appears some are indeed anticipating revenue instability, because the persistence of these recent medium-term conditions would normally provide a boost to the share price.
We don't want to rain on the parade too much, but we did also find 5 warning signs for Kbi Metal (1 is concerning!) that you need to be mindful of.
Of course, profitable companies with a history of great earnings growth are generally safer bets. So you may wish to see this free collection of other companies that have reasonable P/E ratios and have grown earnings strongly.
Valuation is complex, but we're here to simplify it.
Discover if Kbi Metal might be undervalued or overvalued with our detailed analysis, featuring fair value estimates, potential risks, dividends, insider trades, and its financial condition.
Access Free AnalysisHave feedback on this article? Concerned about the content? Get in touch with us directly. Alternatively, email editorial-team (at) simplywallst.com.
This article by Simply Wall St is general in nature. We provide commentary based on historical data and analyst forecasts only using an unbiased methodology and our articles are not intended to be financial advice. It does not constitute a recommendation to buy or sell any stock, and does not take account of your objectives, or your financial situation. We aim to bring you long-term focused analysis driven by fundamental data. Note that our analysis may not factor in the latest price-sensitive company announcements or qualitative material. Simply Wall St has no position in any stocks mentioned.
About KOSDAQ:A024840
Kbi Metal
Engages in the metal and automotive electronical parts businesses in South Korea.
Good value with mediocre balance sheet.
Market Insights

Advertisement
Community Narratives
MINISO's fair value is projected at 26.69 with an anticipated PE ratio shift of 20x
Fair Value US$24.03|11.0% undervalued
BE
Community Contributor
Procter & Gamble: A Dividend Giant Facing Slowing Growth
Fair Value US$119.81|23.3% overvalued
AN
Community Contributor
Eli Lilly's Future Growth Driven by Tirzepatide and Favorable Market Conditions
Fair Value US$1.19k|13.8% undervalued
EA
Community Contributor