Advertisement
- Japan
- /
- Gas Utilities
- /
- TSE:9532
Osaka Gas (TSE:9532): Assessing Valuation After Dividend Hike Signals Renewed Shareholder Focus

Simply Wall St
Reviewed by Simply Wall St
Osaka Gas (TSE:9532) is drawing investor focus after its board approved a significant increase to both its interim and full-year dividend payouts for the fiscal year ending March 2026. This move signals confidence in ongoing financial strength.
See our latest analysis for Osaka Gas.
Backed by strong dividend news, Osaka Gas has seen real momentum build as its share price jumped 8.75% in just one day and has climbed an impressive 40.16% year-to-date. The company’s long-term track record is even more striking, with a 56.86% total shareholder return over one year and a hefty 174.67% over five years. This signals that investor confidence is on the rise.
If this level of performance sparks curiosity about what else is moving in the market, now is a smart time to broaden your search and discover fast growing stocks with high insider ownership
Yet, with such a sharp rally and dividend optimism driving interest, investors may wonder whether Osaka Gas is still trading at a bargain or if the recent surge means the market has already priced in future growth potential.
Price-to-Earnings of 10.6x: Is it justified?
Osaka Gas is trading at a price-to-earnings (P/E) ratio of 10.6x, which is below both industry averages and the broader Japanese market. This suggests it could be undervalued relative to peers.
The P/E ratio measures how much investors are willing to pay for each yen of company earnings. For a utility company like Osaka Gas, this multiple reflects steady earnings power and expectations for future growth.
Osaka Gas trades at 10.6x earnings, compared to an industry average of 13.7x and a Japanese market average of 14.4x. This indicates that the market is pricing the company more conservatively. However, when compared to an estimated fair P/E ratio of 7.3x, the stock appears expensive. This suggests that prices could revert if earnings do not keep pace with optimism.
Explore the SWS fair ratio for Osaka Gas
Result: Price-to-Earnings of 10.6x (ABOUT RIGHT)
However, sluggish revenue and net income growth could challenge the bullish outlook if Osaka Gas does not deliver improved results in upcoming quarters.
Find out about the key risks to this Osaka Gas narrative.
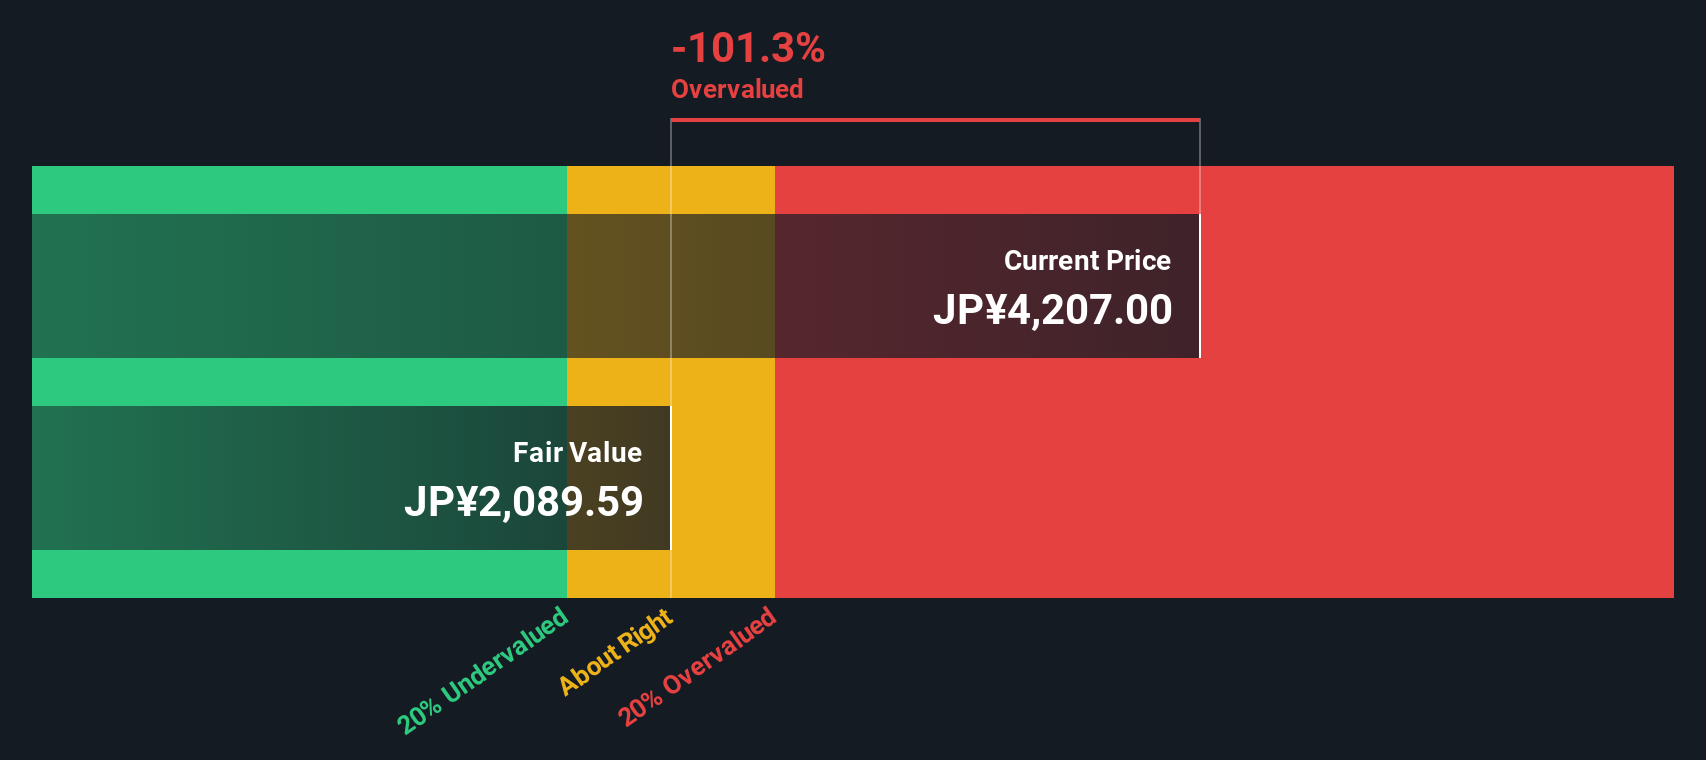
Another View: Our DCF Tells a Different Story
While Osaka Gas looks reasonably valued compared to sector averages, the SWS DCF model paints a less optimistic picture. According to our DCF, the current share price of ¥4,848 is well above an estimated fair value of ¥2,104. This suggests the stock is overvalued if one relies on cash flow projections rather than market multiples. Could market enthusiasm be racing ahead of fundamentals?
Look into how the SWS DCF model arrives at its fair value.
Simply Wall St performs a discounted cash flow (DCF) on every stock in the world every day (check out Osaka Gas for example). We show the entire calculation in full. You can track the result in your watchlist or portfolio and be alerted when this changes, or use our stock screener to discover 839 undervalued stocks based on their cash flows. If you save a screener we even alert you when new companies match - so you never miss a potential opportunity.
Build Your Own Osaka Gas Narrative
If you think the story deserves a different angle or prefer to dig into the numbers yourself, you can craft your own perspective in just a few minutes. Do it your way
A great starting point for your Osaka Gas research is our analysis highlighting 3 key rewards and 1 important warning sign that could impact your investment decision.
Looking for More Investment Ideas?
Step up your investing strategy and seize the opportunities others might overlook. Now is a great time to expand your watchlist using purpose-built tools:
- Spot undervalued gems with strong fundamentals and turn potential into performance by checking out these 839 undervalued stocks based on cash flows before others do.
- Position yourself at the frontier of innovation by targeting artificial intelligence pioneers with these 26 AI penny stocks that are transforming entire industries.
- Secure income potential while embracing steady growth; power up your portfolio using these 22 dividend stocks with yields > 3% yielding over 3%.
This article by Simply Wall St is general in nature. We provide commentary based on historical data and analyst forecasts only using an unbiased methodology and our articles are not intended to be financial advice. It does not constitute a recommendation to buy or sell any stock, and does not take account of your objectives, or your financial situation. We aim to bring you long-term focused analysis driven by fundamental data. Note that our analysis may not factor in the latest price-sensitive company announcements or qualitative material. Simply Wall St has no position in any stocks mentioned.
New: AI Stock Screener & Alerts
Our new AI Stock Screener scans the market every day to uncover opportunities.
• Dividend Powerhouses (3%+ Yield)
• Undervalued Small Caps with Insider Buying
• High growth Tech and AI Companies
Or build your own from over 50 metrics.
Have feedback on this article? Concerned about the content? Get in touch with us directly. Alternatively, email editorial-team@simplywallst.com
About TSE:9532
Osaka Gas
Provides gas, electricity, and other energy products and services in Japan and internationally.
Solid track record with excellent balance sheet and pays a dividend.
Similar Companies
Market Insights

Advertisement
Community Narratives
The company that turned a verb into a global necessity and basically runs the modern internet, digital ads, smartphones, maps, and AI.
Fair Value US$300.00|6.3% undervalued
OS
Community Contributor
Flowers Foods Pays A Fair Price For Health
Fair Value US$16.12|26.0% undervalued
NV
Community Contributor
TMX Group will thrive with 33.3% profit margin and enduring market moat
Fair Value CA$49.90|3.7% overvalued
LI
Community Contributor