- Japan
- /
- Electric Utilities
- /
- TSE:7692
Market Participants Recognise Earth Infinity Co.Ltd.'s (TSE:7692) Revenues Pushing Shares 40% Higher
Earth Infinity Co.Ltd. (TSE:7692) shares have continued their recent momentum with a 40% gain in the last month alone. Still, the 30-day jump doesn't change the fact that longer term shareholders have seen their stock decimated by the 78% share price drop in the last twelve months.
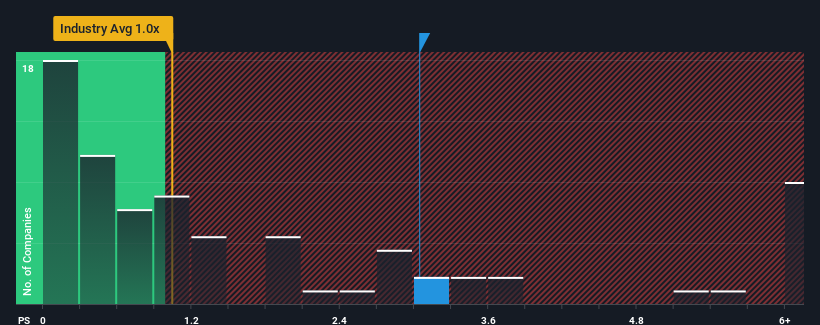
After such a large jump in price, given around half the companies in Japan's Electric Utilities industry have price-to-sales ratios (or "P/S") below 0.3x, you may consider Earth InfinityLtd as a stock to avoid entirely with its 3x P/S ratio. Nonetheless, we'd need to dig a little deeper to determine if there is a rational basis for the highly elevated P/S.
Check out our latest analysis for Earth InfinityLtd

How Has Earth InfinityLtd Performed Recently?
As an illustration, revenue has deteriorated at Earth InfinityLtd over the last year, which is not ideal at all. Perhaps the market believes the company can do enough to outperform the rest of the industry in the near future, which is keeping the P/S ratio high. However, if this isn't the case, investors might get caught out paying too much for the stock.
Although there are no analyst estimates available for Earth InfinityLtd, take a look at this free data-rich visualisation to see how the company stacks up on earnings, revenue and cash flow.How Is Earth InfinityLtd's Revenue Growth Trending?
In order to justify its P/S ratio, Earth InfinityLtd would need to produce outstanding growth that's well in excess of the industry.
In reviewing the last year of financials, we were disheartened to see the company's revenues fell to the tune of 17%. This has soured the latest three-year period, which nevertheless managed to deliver a decent 24% overall rise in revenue. Accordingly, while they would have preferred to keep the run going, shareholders would be roughly satisfied with the medium-term rates of revenue growth.
Weighing the recent medium-term upward revenue trajectory against the broader industry's one-year forecast for contraction of 6.6% shows it's a great look while it lasts.
In light of this, it's understandable that Earth InfinityLtd's P/S sits above the majority of other companies. Investors are willing to pay more for a stock they hope will buck the trend of the broader industry going backwards. Nonetheless, with most other businesses facing an uphill battle, staying on its current revenue path is no certainty.
The Final Word
The strong share price surge has lead to Earth InfinityLtd's P/S soaring as well. Generally, our preference is to limit the use of the price-to-sales ratio to establishing what the market thinks about the overall health of a company.
As detailed previously, the strength of Earth InfinityLtd's recent revenue trends over the medium-term relative to a declining industry is part of the reason why it trades at a higher P/S than its industry counterparts. Right now shareholders are comfortable with the P/S as they are quite confident revenues aren't under threat. We still remain cautious about the company's ability to stay its recent course and swim against the current of the broader industry turmoil. If things remain consistent though, shareholders shouldn't expect any major share price shocks in the near term.
Before you take the next step, you should know about the 5 warning signs for Earth InfinityLtd (2 are potentially serious!) that we have uncovered.
If companies with solid past earnings growth is up your alley, you may wish to see this free collection of other companies with strong earnings growth and low P/E ratios.
Valuation is complex, but we're here to simplify it.
Discover if Earth InfinityLtd might be undervalued or overvalued with our detailed analysis, featuring fair value estimates, potential risks, dividends, insider trades, and its financial condition.
Access Free AnalysisHave feedback on this article? Concerned about the content? Get in touch with us directly. Alternatively, email editorial-team (at) simplywallst.com.
This article by Simply Wall St is general in nature. We provide commentary based on historical data and analyst forecasts only using an unbiased methodology and our articles are not intended to be financial advice. It does not constitute a recommendation to buy or sell any stock, and does not take account of your objectives, or your financial situation. We aim to bring you long-term focused analysis driven by fundamental data. Note that our analysis may not factor in the latest price-sensitive company announcements or qualitative material. Simply Wall St has no position in any stocks mentioned.
About TSE:7692
Earth InfinityLtd
Engages in the electricity and gas retail businesses in Japan.
Outstanding track record with excellent balance sheet.
Market Insights
Community Narratives


Recently Updated Narratives

Astor Enerji will surge with a fair value of $140.43 in the next 3 years

Proximus: The State-Backed Backup Plan with 7% Gross Yield and 15% Currency Upside.


A case for for IMPACT Silver Corp (TSXV:IPT) to reach USD $4.52 (CAD $6.16) in 2026 (23 bagger in 1 year) and USD $5.76 (CAD $7.89) by 2030
Popular Narratives


MicroVision will explode future revenue by 380.37% with a vision towards success


The company that turned a verb into a global necessity and basically runs the modern internet, digital ads, smartphones, maps, and AI.


