- Japan
- /
- Renewable Energy
- /
- TSE:1711
Not Many Are Piling Into SDS HOLDINGS Co.,Ltd. (TSE:1711) Stock Yet As It Plummets 27%

SDS HOLDINGS Co.,Ltd. (TSE:1711) shareholders that were waiting for something to happen have been dealt a blow with a 27% share price drop in the last month. Still, a bad month hasn't completely ruined the past year with the stock gaining 50%, which is great even in a bull market.
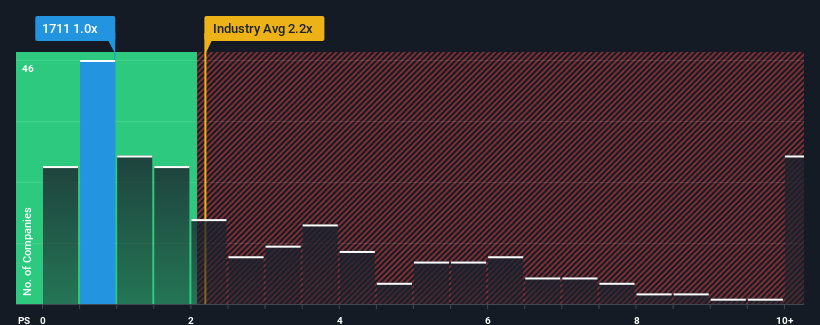
Even after such a large drop in price, it's still not a stretch to say that SDS HOLDINGSLtd's price-to-sales (or "P/S") ratio of 1x right now seems quite "middle-of-the-road" compared to the Renewable Energy industry in Japan, where the median P/S ratio is around 0.9x. While this might not raise any eyebrows, if the P/S ratio is not justified investors could be missing out on a potential opportunity or ignoring looming disappointment.
View our latest analysis for SDS HOLDINGSLtd
How Has SDS HOLDINGSLtd Performed Recently?
Revenue has risen firmly for SDS HOLDINGSLtd recently, which is pleasing to see. Perhaps the market is expecting future revenue performance to only keep up with the broader industry, which has keeping the P/S in line with expectations. If you like the company, you'd be hoping this isn't the case so that you could potentially pick up some stock while it's not quite in favour.
Want the full picture on earnings, revenue and cash flow for the company? Then our free report on SDS HOLDINGSLtd will help you shine a light on its historical performance.How Is SDS HOLDINGSLtd's Revenue Growth Trending?
The only time you'd be comfortable seeing a P/S like SDS HOLDINGSLtd's is when the company's growth is tracking the industry closely.
Retrospectively, the last year delivered an exceptional 22% gain to the company's top line. This great performance means it was also able to deliver immense revenue growth over the last three years. Therefore, it's fair to say the revenue growth recently has been superb for the company.
This is in contrast to the rest of the industry, which is expected to grow by 14% over the next year, materially lower than the company's recent medium-term annualised growth rates.
With this information, we find it interesting that SDS HOLDINGSLtd is trading at a fairly similar P/S compared to the industry. Apparently some shareholders believe the recent performance is at its limits and have been accepting lower selling prices.
The Final Word
Following SDS HOLDINGSLtd's share price tumble, its P/S is just clinging on to the industry median P/S. It's argued the price-to-sales ratio is an inferior measure of value within certain industries, but it can be a powerful business sentiment indicator.
We didn't quite envision SDS HOLDINGSLtd's P/S sitting in line with the wider industry, considering the revenue growth over the last three-year is higher than the current industry outlook. When we see strong revenue with faster-than-industry growth, we can only assume potential risks are what might be placing pressure on the P/S ratio. At least the risk of a price drop looks to be subdued if recent medium-term revenue trends continue, but investors seem to think future revenue could see some volatility.
You need to take note of risks, for example - SDS HOLDINGSLtd has 3 warning signs (and 1 which is concerning) we think you should know about.
If strong companies turning a profit tickle your fancy, then you'll want to check out this free list of interesting companies that trade on a low P/E (but have proven they can grow earnings).
The New Payments ETF Is Live on NASDAQ:
Money is moving to real-time rails, and a newly listed ETF now gives investors direct exposure. Fast settlement. Institutional custody. Simple access.
Explore how this launch could reshape portfolios
Sponsored ContentNew: Manage All Your Stock Portfolios in One Place
We've created the ultimate portfolio companion for stock investors, and it's free.
• Connect an unlimited number of Portfolios and see your total in one currency
• Be alerted to new Warning Signs or Risks via email or mobile
• Track the Fair Value of your stocks
Have feedback on this article? Concerned about the content? Get in touch with us directly. Alternatively, email editorial-team (at) simplywallst.com.
This article by Simply Wall St is general in nature. We provide commentary based on historical data and analyst forecasts only using an unbiased methodology and our articles are not intended to be financial advice. It does not constitute a recommendation to buy or sell any stock, and does not take account of your objectives, or your financial situation. We aim to bring you long-term focused analysis driven by fundamental data. Note that our analysis may not factor in the latest price-sensitive company announcements or qualitative material. Simply Wall St has no position in any stocks mentioned.
About TSE:1711
SDS HOLDINGSLtd
Engages in renewable energy, energy saving, and facility solution businesses in Japan.
Low risk and slightly overvalued.
Market Insights

Weekly Picks

Early mover in a fast growing industry. Likely to experience share price volatility as they scale


A case for CA$31.80 (undiluted), aka 8,616% upside from CA$0.37 (an 86 bagger!).


Moderation and Stabilisation: HOLD: Fair Price based on a 4-year Cycle is $12.08
Recently Updated Narratives

Automotive Electronics Manufacturer Consistent and Stable

Airbnb Stock: Platform Growth in a World of Saturation and Scrutiny

Adobe Stock: AI-Fueled ARR Growth Pushes Guidance Higher, But Cost Pressures Loom
Popular Narratives


Crazy Undervalued 42 Baggers Silver Play (Active & Running Mine)


NVDA: Expanding AI Demand Will Drive Major Data Center Investments Through 2026

The AI Infrastructure Giant Grows Into Its Valuation
Trending Discussion


