
Advertisement
Howard Marks put it nicely when he said that, rather than worrying about share price volatility, 'The possibility of permanent loss is the risk I worry about... and every practical investor I know worries about.' When we think about how risky a company is, we always like to look at its use of debt, since debt overload can lead to ruin. As with many other companies Pixel Companyz Inc. (TYO:2743) makes use of debt. But should shareholders be worried about its use of debt?
Why Does Debt Bring Risk?
Debt assists a business until the business has trouble paying it off, either with new capital or with free cash flow. In the worst case scenario, a company can go bankrupt if it cannot pay its creditors. However, a more usual (but still expensive) situation is where a company must dilute shareholders at a cheap share price simply to get debt under control. Of course, plenty of companies use debt to fund growth, without any negative consequences. The first thing to do when considering how much debt a business uses is to look at its cash and debt together.
See our latest analysis for Pixel Companyz
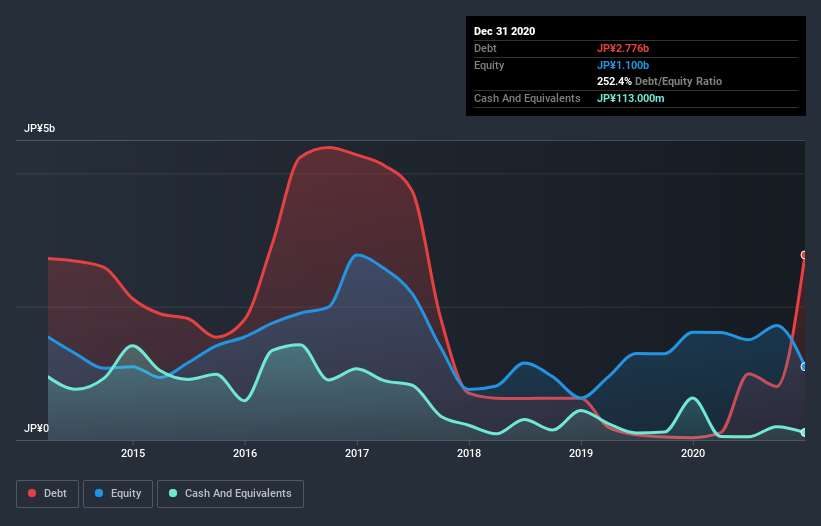
What Is Pixel Companyz's Net Debt?
As you can see below, at the end of December 2020, Pixel Companyz had JP¥2.78b of debt, up from JP¥35.0m a year ago. Click the image for more detail. On the flip side, it has JP¥113.0m in cash leading to net debt of about JP¥2.66b.
How Healthy Is Pixel Companyz's Balance Sheet?
Zooming in on the latest balance sheet data, we can see that Pixel Companyz had liabilities of JP¥3.23b due within 12 months and liabilities of JP¥7.00m due beyond that. Offsetting these obligations, it had cash of JP¥113.0m as well as receivables valued at JP¥133.0m due within 12 months. So its liabilities total JP¥2.99b more than the combination of its cash and short-term receivables.
This is a mountain of leverage relative to its market capitalization of JP¥4.28b. This suggests shareholders would be heavily diluted if the company needed to shore up its balance sheet in a hurry. When analysing debt levels, the balance sheet is the obvious place to start. But it is Pixel Companyz's earnings that will influence how the balance sheet holds up in the future. So if you're keen to discover more about its earnings, it might be worth checking out this graph of its long term earnings trend.
In the last year Pixel Companyz had a loss before interest and tax, and actually shrunk its revenue by 6.5%, to JP¥2.4b. That's not what we would hope to see.
Caveat Emptor
Importantly, Pixel Companyz had an earnings before interest and tax (EBIT) loss over the last year. Indeed, it lost JP¥299m at the EBIT level. When we look at that and recall the liabilities on its balance sheet, relative to cash, it seems unwise to us for the company to have any debt. Quite frankly we think the balance sheet is far from match-fit, although it could be improved with time. Another cause for caution is that is bled JP¥1.9b in negative free cash flow over the last twelve months. So suffice it to say we consider the stock very risky. When analysing debt levels, the balance sheet is the obvious place to start. However, not all investment risk resides within the balance sheet - far from it. For example Pixel Companyz has 4 warning signs (and 2 which are concerning) we think you should know about.
If, after all that, you're more interested in a fast growing company with a rock-solid balance sheet, then check out our list of net cash growth stocks without delay.
If you’re looking to trade Pixel Companyz, open an account with the lowest-cost* platform trusted by professionals, Interactive Brokers. Their clients from over 200 countries and territories trade stocks, options, futures, forex, bonds and funds worldwide from a single integrated account. Promoted
New: Manage All Your Stock Portfolios in One Place
We've created the ultimate portfolio companion for stock investors, and it's free.
• Connect an unlimited number of Portfolios and see your total in one currency
• Be alerted to new Warning Signs or Risks via email or mobile
• Track the Fair Value of your stocks
This article by Simply Wall St is general in nature. It does not constitute a recommendation to buy or sell any stock, and does not take account of your objectives, or your financial situation. We aim to bring you long-term focused analysis driven by fundamental data. Note that our analysis may not factor in the latest price-sensitive company announcements or qualitative material. Simply Wall St has no position in any stocks mentioned.
*Interactive Brokers Rated Lowest Cost Broker by StockBrokers.com Annual Online Review 2020
Have feedback on this article? Concerned about the content? Get in touch with us directly. Alternatively, email editorial-team (at) simplywallst.com.
About TSE:2743
Pixel Companyz
Engages in the system innovation data center businesses primarily in Japan.
Moderate risk with weak fundamentals.
Market Insights

Advertisement
Weekly Picks
RO


RockeTeller on Santacruz Silver Mining ·
Crazy Undervalued 42 Baggers Silver Play (Active & Running Mine)
Fair Value:CA$8696.7% undervalued
61 followersusers have followed this narrative
7 commentsusers have commented on this narrative
17 likesusers have liked this narrative
RO


Robbo on Fiducian Group ·
Fiducian: Compliance Clouds or Value Opportunity?
Fair Value:AU$122.0% undervalued
9 followersusers have followed this narrative
0 commentsusers have commented on this narrative
0 likesusers have liked this narrative
WO

woodworthfund on Willamette Valley Vineyards ·
Willamette Valley Vineyards (WVVI): Not-So-Great Value
Fair Value:US$242.5% overvalued
10 followersusers have followed this narrative
0 commentsusers have commented on this narrative
1 likeusers have liked this narrative
Recently Updated Narratives
WO

woodworthfund on MGP Ingredients ·
THE KINGDOM OF BROWN GOODS: WHY MGPI IS BEING CRUSHED BY INVENTORY & PRIMED FOR RESURRECTION
Fair Value:US$4035.8% undervalued
3 followersusers have followed this narrative
0 commentsusers have commented on this narrative
0 likesusers have liked this narrative
DA


davidlsander on Beam Therapeutics ·
The "Molecular Pencil": Why Beam's Technology is Built to Win
Fair Value:US$15081.9% undervalued
53 followersusers have followed this narrative
3 commentsusers have commented on this narrative
1 likeusers have liked this narrative
MO


mo7md on ADNOC Gas ·
ADNOC Gas future shines with a 21.4% revenue surge
Fair Value:د.إ3.728.9% undervalued
3 followersusers have followed this narrative
0 commentsusers have commented on this narrative
0 likesusers have liked this narrative
Popular Narratives
TH


TheWallstreetKing on MicroVision ·
MicroVision will explode future revenue by 380.37% with a vision towards success
Fair Value:US$6098.5% undervalued
117 followersusers have followed this narrative
11 commentsusers have commented on this narrative
22 likesusers have liked this narrative
AN


AnalystConsensusTarget on NVIDIA ·
NVDA: Expanding AI Demand Will Drive Major Data Center Investments Through 2026
Fair Value:US$250.3927.2% undervalued
959 followersusers have followed this narrative
6 commentsusers have commented on this narrative
25 likesusers have liked this narrative
RO
RockeTeller on Santacruz Silver Mining ·
Crazy Undervalued 42 Baggers Silver Play (Active & Running Mine)
Fair Value:CA$8696.7% undervalued
61 followersusers have followed this narrative
7 commentsusers have commented on this narrative
17 likesusers have liked this narrative
