Sankyu (TSE:9065) earnings and shareholder returns have been trending downwards for the last five years, but the stock lifts 4.1% this past week


In order to justify the effort of selecting individual stocks, it's worth striving to beat the returns from a market index fund. But in any portfolio, there will be mixed results between individual stocks. At this point some shareholders may be questioning their investment in Sankyu Inc. (TSE:9065), since the last five years saw the share price fall 14%. Shareholders have had an even rougher run lately, with the share price down 11% in the last 90 days.
On a more encouraging note the company has added JP¥10b to its market cap in just the last 7 days, so let's see if we can determine what's driven the five-year loss for shareholders.
See our latest analysis for Sankyu
There is no denying that markets are sometimes efficient, but prices do not always reflect underlying business performance. One way to examine how market sentiment has changed over time is to look at the interaction between a company's share price and its earnings per share (EPS).
Looking back five years, both Sankyu's share price and EPS declined; the latter at a rate of 0.03% per year. This reduction in EPS is less than the 3% annual reduction in the share price. This implies that the market was previously too optimistic about the stock. The less favorable sentiment is reflected in its current P/E ratio of 10.86.
You can see how EPS has changed over time in the image below (click on the chart to see the exact values).
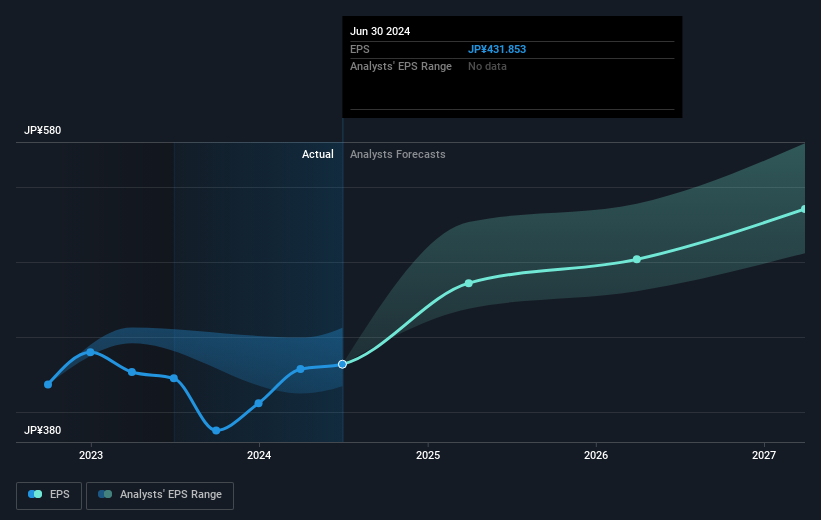
Before buying or selling a stock, we always recommend a close examination of historic growth trends, available here.
What About Dividends?
When looking at investment returns, it is important to consider the difference between total shareholder return (TSR) and share price return. Whereas the share price return only reflects the change in the share price, the TSR includes the value of dividends (assuming they were reinvested) and the benefit of any discounted capital raising or spin-off. It's fair to say that the TSR gives a more complete picture for stocks that pay a dividend. As it happens, Sankyu's TSR for the last 5 years was -2.1%, which exceeds the share price return mentioned earlier. And there's no prize for guessing that the dividend payments largely explain the divergence!
A Different Perspective
Investors in Sankyu had a tough year, with a total loss of 4.6% (including dividends), against a market gain of about 11%. However, keep in mind that even the best stocks will sometimes underperform the market over a twelve month period. Regrettably, last year's performance caps off a bad run, with the shareholders facing a total loss of 0.4% per year over five years. Generally speaking long term share price weakness can be a bad sign, though contrarian investors might want to research the stock in hope of a turnaround. I find it very interesting to look at share price over the long term as a proxy for business performance. But to truly gain insight, we need to consider other information, too. Even so, be aware that Sankyu is showing 1 warning sign in our investment analysis , you should know about...
Of course, you might find a fantastic investment by looking elsewhere. So take a peek at this free list of companies we expect will grow earnings.
Please note, the market returns quoted in this article reflect the market weighted average returns of stocks that currently trade on Japanese exchanges.
New: Manage All Your Stock Portfolios in One Place
We've created the ultimate portfolio companion for stock investors, and it's free.
• Connect an unlimited number of Portfolios and see your total in one currency
• Be alerted to new Warning Signs or Risks via email or mobile
• Track the Fair Value of your stocks
Have feedback on this article? Concerned about the content? Get in touch with us directly. Alternatively, email editorial-team (at) simplywallst.com.
This article by Simply Wall St is general in nature. We provide commentary based on historical data and analyst forecasts only using an unbiased methodology and our articles are not intended to be financial advice. It does not constitute a recommendation to buy or sell any stock, and does not take account of your objectives, or your financial situation. We aim to bring you long-term focused analysis driven by fundamental data. Note that our analysis may not factor in the latest price-sensitive company announcements or qualitative material. Simply Wall St has no position in any stocks mentioned.
About TSE:9065
Excellent balance sheet, good value and pays a dividend.
