
Advertisement
- Japan
- /
- Transportation
- /
- TSE:9059
Take Care Before Jumping Onto Kanda Holdings Co.,Ltd. (TSE:9059) Even Though It's 25% Cheaper
The Kanda Holdings Co.,Ltd. (TSE:9059) share price has fared very poorly over the last month, falling by a substantial 25%. The recent drop has obliterated the annual return, with the share price now down 6.5% over that longer period.
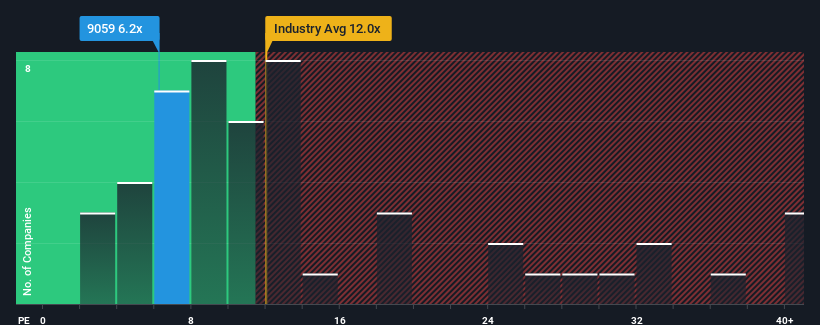
In spite of the heavy fall in price, Kanda HoldingsLtd may still be sending very bullish signals at the moment with its price-to-earnings (or "P/E") ratio of 6.2x, since almost half of all companies in Japan have P/E ratios greater than 14x and even P/E's higher than 21x are not unusual. Although, it's not wise to just take the P/E at face value as there may be an explanation why it's so limited.
Kanda HoldingsLtd has been doing a good job lately as it's been growing earnings at a solid pace. It might be that many expect the respectable earnings performance to degrade substantially, which has repressed the P/E. If you like the company, you'd be hoping this isn't the case so that you could potentially pick up some stock while it's out of favour.
View our latest analysis for Kanda HoldingsLtd
How Is Kanda HoldingsLtd's Growth Trending?
In order to justify its P/E ratio, Kanda HoldingsLtd would need to produce anemic growth that's substantially trailing the market.
Retrospectively, the last year delivered an exceptional 28% gain to the company's bottom line. The latest three year period has also seen an excellent 52% overall rise in EPS, aided by its short-term performance. So we can start by confirming that the company has done a great job of growing earnings over that time.
Weighing that recent medium-term earnings trajectory against the broader market's one-year forecast for expansion of 9.8% shows it's noticeably more attractive on an annualised basis.
With this information, we find it odd that Kanda HoldingsLtd is trading at a P/E lower than the market. Apparently some shareholders believe the recent performance has exceeded its limits and have been accepting significantly lower selling prices.
The Key Takeaway
Kanda HoldingsLtd's P/E looks about as weak as its stock price lately. Using the price-to-earnings ratio alone to determine if you should sell your stock isn't sensible, however it can be a practical guide to the company's future prospects.
Our examination of Kanda HoldingsLtd revealed its three-year earnings trends aren't contributing to its P/E anywhere near as much as we would have predicted, given they look better than current market expectations. When we see strong earnings with faster-than-market growth, we assume potential risks are what might be placing significant pressure on the P/E ratio. At least price risks look to be very low if recent medium-term earnings trends continue, but investors seem to think future earnings could see a lot of volatility.
Don't forget that there may be other risks. For instance, we've identified 2 warning signs for Kanda HoldingsLtd that you should be aware of.
If P/E ratios interest you, you may wish to see this free collection of other companies with strong earnings growth and low P/E ratios.
Valuation is complex, but we're here to simplify it.
Discover if Kanda HoldingsLtd might be undervalued or overvalued with our detailed analysis, featuring fair value estimates, potential risks, dividends, insider trades, and its financial condition.
Access Free AnalysisHave feedback on this article? Concerned about the content? Get in touch with us directly. Alternatively, email editorial-team (at) simplywallst.com.
This article by Simply Wall St is general in nature. We provide commentary based on historical data and analyst forecasts only using an unbiased methodology and our articles are not intended to be financial advice. It does not constitute a recommendation to buy or sell any stock, and does not take account of your objectives, or your financial situation. We aim to bring you long-term focused analysis driven by fundamental data. Note that our analysis may not factor in the latest price-sensitive company announcements or qualitative material. Simply Wall St has no position in any stocks mentioned.
Have feedback on this article? Concerned about the content? Get in touch with us directly. Alternatively, email editorial-team@simplywallst.com
About TSE:9059
Kanda HoldingsLtd
Through its subsidiaries, operates as a logistics company in Japan and internationally.
Flawless balance sheet established dividend payer.
Market Insights

Advertisement
Community Narratives
MINISO's fair value is projected at 26.69 with an anticipated PE ratio shift of 20x
Fair Value US$24.03|11.0% undervalued
BE
Community Contributor
Procter & Gamble: A Dividend Giant Facing Slowing Growth
Fair Value US$119.81|23.3% overvalued
AN
Community Contributor
Eli Lilly's Future Growth Driven by Tirzepatide and Favorable Market Conditions
Fair Value US$1.19k|13.8% undervalued
EA
Community Contributor