Advertisement
- Japan
- /
- Wireless Telecom
- /
- TSE:9984
Should Investors Rethink SoftBank After a 182% Surge and Bold AI Moves in 2025?

Simply Wall St
Reviewed by Bailey Pemberton
- Wondering if SoftBank Group is a bargain right now? You are not alone, especially with so many investors curious about what is driving its market value these days.
- The stock has had a wild ride, dropping 4.3% in the past week but surging 25.9% over the last month and an incredible 182.3% in the past year. These moves certainly grab attention for its growth story and shifting investor sentiment.
- Recent headlines have centered on SoftBank’s bold moves in the artificial intelligence and tech space as the company continues to make high-profile investments and strategic shifts. SoftBank’s Vision Fund portfolio and leadership in next-generation technology deals have fueled speculation about its future, helping to explain some of the dramatic price movements.
- Despite all the excitement, SoftBank Group scores just 0 out of 6 checks on traditional undervaluation screens. Next, we will break down what these methods reveal. The real secret to understanding SoftBank’s valuation will be at the end of this article.
SoftBank Group scores just 0/6 on our valuation checks. See what other red flags we found in the full valuation breakdown.
Approach 1: SoftBank Group Discounted Cash Flow (DCF) Analysis
A Discounted Cash Flow (DCF) valuation projects a company's future cash flows and discounts them back to their present value to estimate what the business is fundamentally worth today. This method assumes the company will continue to generate cash over the years and tries to determine how much those future earnings are worth right now.
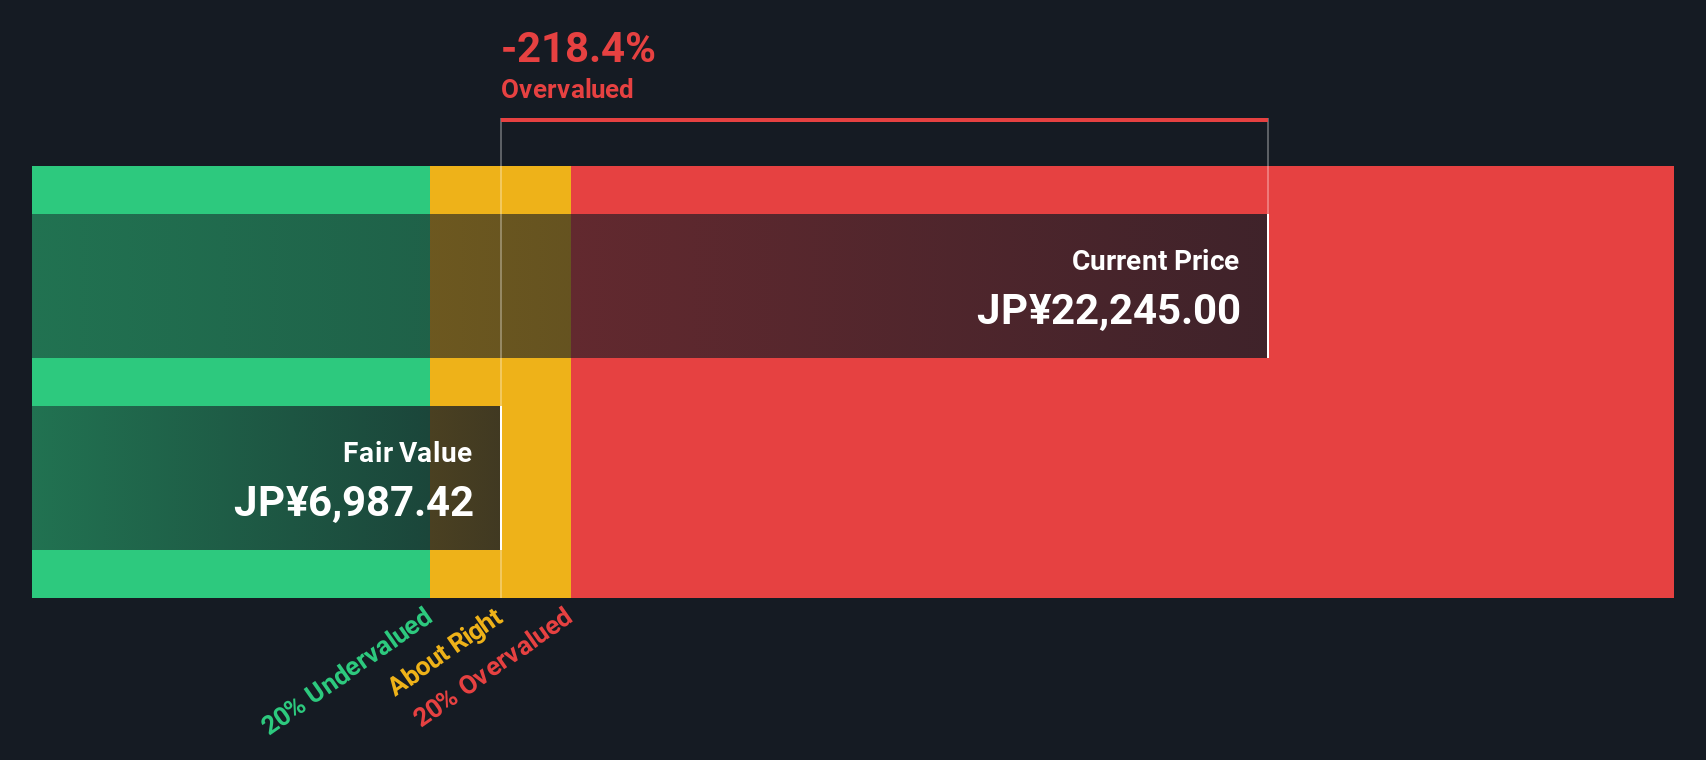
For SoftBank Group, the two-stage DCF model is used. Currently, the company's Free Cash Flow (FCF) is negative, standing at approximately ¥-787 billion. Analysts expect this to rise significantly over time, with projected FCF for the year ending March 2030 estimated at ¥504 billion. The model incorporates several years of analyst estimates, and further projections beyond that are extrapolated.
Based on these cash flow projections, the intrinsic value for SoftBank Group shares comes out to roughly ¥6,655 per share. However, the DCF suggests the stock trades at a 278.0% premium to its estimated fair value. This indicates it appears substantially overvalued by this methodology.
Result: OVERVALUED
Our Discounted Cash Flow (DCF) analysis suggests SoftBank Group may be overvalued by 278.0%. Discover 844 undervalued stocks or create your own screener to find better value opportunities.
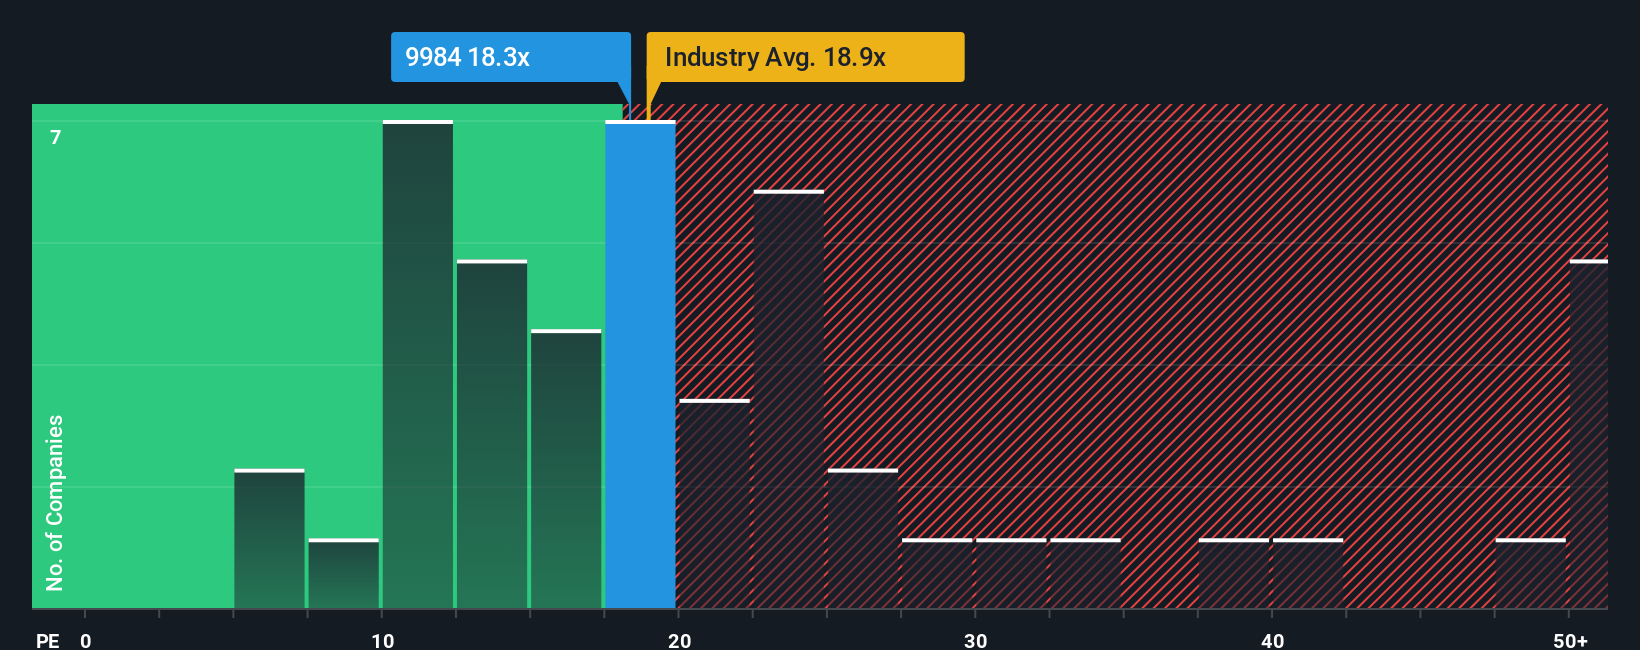
Approach 2: SoftBank Group Price vs Earnings
The Price-to-Earnings (PE) ratio is a widely used valuation metric for profitable companies because it allows investors to compare the price they are paying for each yen of earnings. This makes it a practical tool for judging whether a stock’s current price reflects its earnings power, especially for established businesses that consistently generate profits.
A "normal" or "fair" PE ratio depends on several factors, most notably the company’s growth outlook and perceived risk. Companies with higher expected earnings growth or lower risks typically command higher PE multiples. Slower-growing or riskier firms tend to have lower PEs.
SoftBank Group currently trades on a PE ratio of 20.7x. For context, the average PE for the Wireless Telecom industry is 18.4x. The average of its direct peers is 16.5x. This suggests that investors are willing to pay a premium for SoftBank Group compared to its sector and peer group.
Simply Wall St provides a proprietary “Fair Ratio,” in this case 20.6x, representing the PE multiple SoftBank Group deserves based on its specific earnings growth prospects, profit margins, industry positioning, market cap, and risk profile. Unlike a simple comparison with industry averages or peer multiples, the Fair Ratio delivers a more tailored valuation hurdle that accounts for the unique mix of company-specific strengths and risks.
Comparing the Fair Ratio of 20.6x with the actual PE of 20.7x reveals that SoftBank Group’s current valuation is about right according to this metric.
Result: ABOUT RIGHT
PE ratios tell one story, but what if the real opportunity lies elsewhere? Discover 1410 companies where insiders are betting big on explosive growth.
Upgrade Your Decision Making: Choose your SoftBank Group Narrative
Earlier we mentioned that there is an even better way to understand valuation, so let's introduce you to Narratives. A Narrative is a clear, personalized story that connects your perspective about a company—why you think it will succeed or face challenges—with your assumptions about its future revenue, profit margins, and fair value. Narratives go beyond simple ratios by tying a company’s business drivers and risks to a dynamic financial forecast, helping you estimate what you think it is truly worth.
On Simply Wall St, Narratives are easy to use and available on the Community page, supported by millions of investors worldwide. Narratives allow you to weigh the current share price against your calculated Fair Value, providing a smarter framework for deciding when to buy or sell. They update automatically as new news, earnings, and analyst data become available, so your analysis stays relevant as conditions change.
For SoftBank Group, one investor might believe its investments in AI and technology IPOs justify a fair value of ¥20,000 per share. Another investor, more cautious about leverage and near-term risks, might set their fair value at just ¥9,400 per share. Narratives empower you to make these assessments yourself, with clarity and confidence.
Do you think there's more to the story for SoftBank Group? Head over to our Community to see what others are saying!

This article by Simply Wall St is general in nature. We provide commentary based on historical data and analyst forecasts only using an unbiased methodology and our articles are not intended to be financial advice. It does not constitute a recommendation to buy or sell any stock, and does not take account of your objectives, or your financial situation. We aim to bring you long-term focused analysis driven by fundamental data. Note that our analysis may not factor in the latest price-sensitive company announcements or qualitative material. Simply Wall St has no position in any stocks mentioned.
New: Manage All Your Stock Portfolios in One Place
We've created the ultimate portfolio companion for stock investors, and it's free.
• Connect an unlimited number of Portfolios and see your total in one currency
• Be alerted to new Warning Signs or Risks via email or mobile
• Track the Fair Value of your stocks
Have feedback on this article? Concerned about the content? Get in touch with us directly. Alternatively, email editorial-team@simplywallst.com
About TSE:9984
SoftBank Group
Provides telecommunication services in Japan and internationally.
Proven track record with slight risk.
Similar Companies
Market Insights

Advertisement
Community Narratives
The company that turned a verb into a global necessity and basically runs the modern internet, digital ads, smartphones, maps, and AI.
Fair Value US$300.00|7.5% undervalued
OS
Community Contributor
Flowers Foods Pays A Fair Price For Health
Fair Value US$16.12|25.4% undervalued
NV
Community Contributor
TMX Group will thrive with 33.3% profit margin and enduring market moat
Fair Value CA$49.90|3.6% overvalued
LI
Community Contributor
The "Molecular Pencil": Why Beam's Technology is Built to Win
Fair Value US$65.01|65.0% undervalued
DA
Community Contributor