
Advertisement
- Japan
- /
- Telecom Services and Carriers
- /
- TSE:9418
Does U-NEXT HOLDINGSLtd (TSE:9418) Have A Healthy Balance Sheet?
Warren Buffett famously said, 'Volatility is far from synonymous with risk.' It's only natural to consider a company's balance sheet when you examine how risky it is, since debt is often involved when a business collapses. As with many other companies U-NEXT HOLDINGS Co.,Ltd. (TSE:9418) makes use of debt. But should shareholders be worried about its use of debt?
What Risk Does Debt Bring?
Debt assists a business until the business has trouble paying it off, either with new capital or with free cash flow. Ultimately, if the company can't fulfill its legal obligations to repay debt, shareholders could walk away with nothing. However, a more usual (but still expensive) situation is where a company must dilute shareholders at a cheap share price simply to get debt under control. Of course, debt can be an important tool in businesses, particularly capital heavy businesses. When we examine debt levels, we first consider both cash and debt levels, together.
What Is U-NEXT HOLDINGSLtd's Debt?
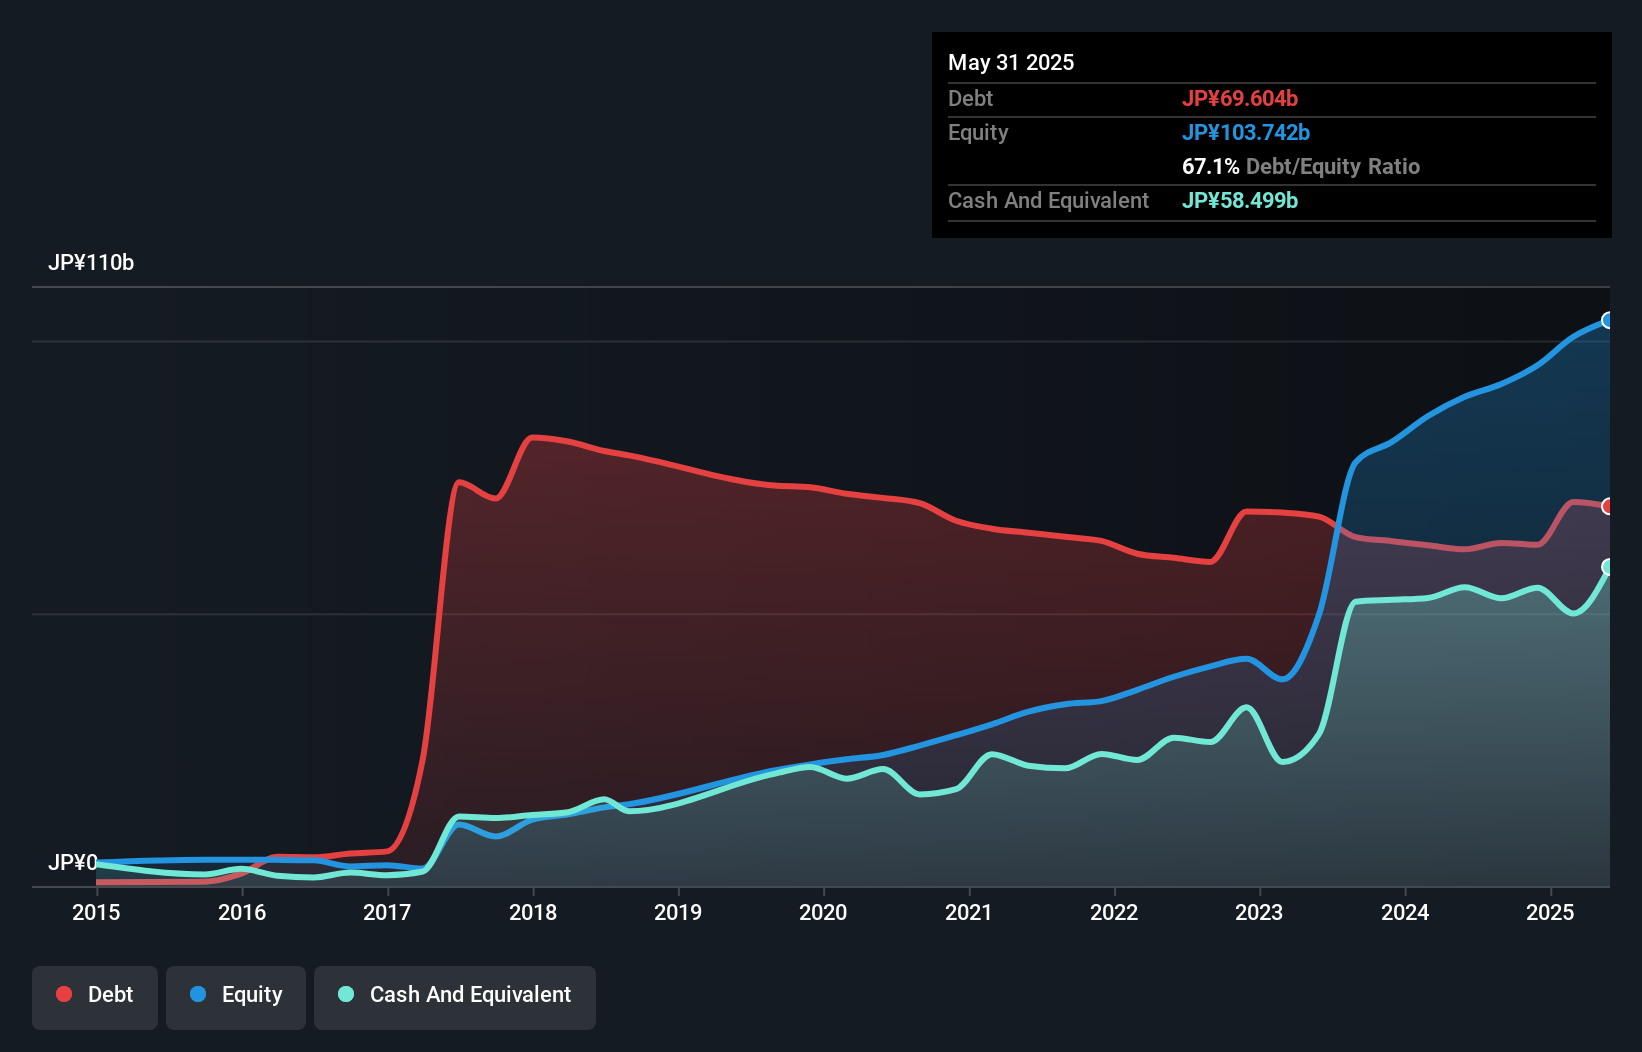
As you can see below, at the end of May 2025, U-NEXT HOLDINGSLtd had JP¥69.6b of debt, up from JP¥61.7b a year ago. Click the image for more detail. On the flip side, it has JP¥58.5b in cash leading to net debt of about JP¥11.1b.
How Healthy Is U-NEXT HOLDINGSLtd's Balance Sheet?
Zooming in on the latest balance sheet data, we can see that U-NEXT HOLDINGSLtd had liabilities of JP¥76.8b due within 12 months and liabilities of JP¥72.2b due beyond that. On the other hand, it had cash of JP¥58.5b and JP¥40.8b worth of receivables due within a year. So its liabilities outweigh the sum of its cash and (near-term) receivables by JP¥49.6b.
Of course, U-NEXT HOLDINGSLtd has a market capitalization of JP¥384.2b, so these liabilities are probably manageable. But there are sufficient liabilities that we would certainly recommend shareholders continue to monitor the balance sheet, going forward.
See our latest analysis for U-NEXT HOLDINGSLtd
We use two main ratios to inform us about debt levels relative to earnings. The first is net debt divided by earnings before interest, tax, depreciation, and amortization (EBITDA), while the second is how many times its earnings before interest and tax (EBIT) covers its interest expense (or its interest cover, for short). Thus we consider debt relative to earnings both with and without depreciation and amortization expenses.
U-NEXT HOLDINGSLtd's net debt is only 0.27 times its EBITDA. And its EBIT easily covers its interest expense, being 42.2 times the size. So you could argue it is no more threatened by its debt than an elephant is by a mouse. While U-NEXT HOLDINGSLtd doesn't seem to have gained much on the EBIT line, at least earnings remain stable for now. The balance sheet is clearly the area to focus on when you are analysing debt. But it is future earnings, more than anything, that will determine U-NEXT HOLDINGSLtd's ability to maintain a healthy balance sheet going forward. So if you want to see what the professionals think, you might find this free report on analyst profit forecasts to be interesting.
Finally, a business needs free cash flow to pay off debt; accounting profits just don't cut it. So we clearly need to look at whether that EBIT is leading to corresponding free cash flow. Over the last three years, U-NEXT HOLDINGSLtd reported free cash flow worth 5.9% of its EBIT, which is really quite low. That limp level of cash conversion undermines its ability to manage and pay down debt.
Our View
Both U-NEXT HOLDINGSLtd's ability to to cover its interest expense with its EBIT and its net debt to EBITDA gave us comfort that it can handle its debt. But truth be told its conversion of EBIT to free cash flow had us nibbling our nails. When we consider all the elements mentioned above, it seems to us that U-NEXT HOLDINGSLtd is managing its debt quite well. Having said that, the load is sufficiently heavy that we would recommend any shareholders keep a close eye on it. Above most other metrics, we think its important to track how fast earnings per share is growing, if at all. If you've also come to that realization, you're in luck, because today you can view this interactive graph of U-NEXT HOLDINGSLtd's earnings per share history for free.
When all is said and done, sometimes its easier to focus on companies that don't even need debt. Readers can access a list of growth stocks with zero net debt 100% free, right now.
New: AI Stock Screener & Alerts
Our new AI Stock Screener scans the market every day to uncover opportunities.
• Dividend Powerhouses (3%+ Yield)
• Undervalued Small Caps with Insider Buying
• High growth Tech and AI Companies
Or build your own from over 50 metrics.
Have feedback on this article? Concerned about the content? Get in touch with us directly. Alternatively, email editorial-team (at) simplywallst.com.
This article by Simply Wall St is general in nature. We provide commentary based on historical data and analyst forecasts only using an unbiased methodology and our articles are not intended to be financial advice. It does not constitute a recommendation to buy or sell any stock, and does not take account of your objectives, or your financial situation. We aim to bring you long-term focused analysis driven by fundamental data. Note that our analysis may not factor in the latest price-sensitive company announcements or qualitative material. Simply Wall St has no position in any stocks mentioned.
About TSE:9418
Flawless balance sheet with moderate growth potential.
Market Insights

Advertisement
Community Narratives
MicroVision will explode future revenue by 380.37% with a vision towards success
Fair Value US$60.00|98.5% undervalued
TH
Community Contributor
The Indispensable Artery for a New North American Economy
Fair Value CA$132.87|2.3% undervalued
TI
Community Contributor