
Advertisement
Unsurprisingly, IPS, Inc.'s (TSE:4390) stock price was strong on the back of its healthy earnings report. However, our analysis suggests that shareholders may be missing some factors that indicate the earnings result was not as good as it looked.
View our latest analysis for IPS
Zooming In On IPS' Earnings
Many investors haven't heard of the accrual ratio from cashflow, but it is actually a useful measure of how well a company's profit is backed up by free cash flow (FCF) during a given period. In plain english, this ratio subtracts FCF from net profit, and divides that number by the company's average operating assets over that period. This ratio tells us how much of a company's profit is not backed by free cashflow.
As a result, a negative accrual ratio is a positive for the company, and a positive accrual ratio is a negative. While it's not a problem to have a positive accrual ratio, indicating a certain level of non-cash profits, a high accrual ratio is arguably a bad thing, because it indicates paper profits are not matched by cash flow. To quote a 2014 paper by Lewellen and Resutek, "firms with higher accruals tend to be less profitable in the future".
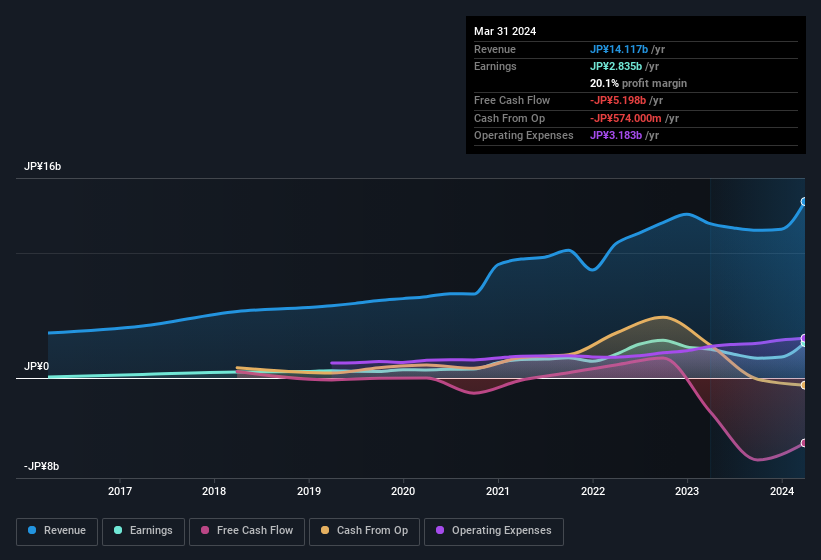
IPS has an accrual ratio of 0.49 for the year to March 2024. As a general rule, that bodes poorly for future profitability. And indeed, during the period the company didn't produce any free cash flow whatsoever. Over the last year it actually had negative free cash flow of JP¥5.2b, in contrast to the aforementioned profit of JP¥2.84b. We also note that IPS' free cash flow was actually negative last year as well, so we could understand if shareholders were bothered by its outflow of JP¥5.2b.
Note: we always recommend investors check balance sheet strength. Click here to be taken to our balance sheet analysis of IPS.
Our Take On IPS' Profit Performance
As we discussed above, we think IPS' earnings were not supported by free cash flow, which might concern some investors. For this reason, we think that IPS' statutory profits may be a bad guide to its underlying earnings power, and might give investors an overly positive impression of the company. But on the bright side, its earnings per share have grown at an extremely impressive rate over the last three years. Of course, we've only just scratched the surface when it comes to analysing its earnings; one could also consider margins, forecast growth, and return on investment, among other factors. With this in mind, we wouldn't consider investing in a stock unless we had a thorough understanding of the risks. Every company has risks, and we've spotted 2 warning signs for IPS (of which 1 is a bit concerning!) you should know about.
Today we've zoomed in on a single data point to better understand the nature of IPS' profit. But there are plenty of other ways to inform your opinion of a company. For example, many people consider a high return on equity as an indication of favorable business economics, while others like to 'follow the money' and search out stocks that insiders are buying. While it might take a little research on your behalf, you may find this free collection of companies boasting high return on equity, or this list of stocks with significant insider holdings to be useful.
New: AI Stock Screener & Alerts
Our new AI Stock Screener scans the market every day to uncover opportunities.
• Dividend Powerhouses (3%+ Yield)
• Undervalued Small Caps with Insider Buying
• High growth Tech and AI Companies
Or build your own from over 50 metrics.
Have feedback on this article? Concerned about the content? Get in touch with us directly. Alternatively, email editorial-team (at) simplywallst.com.
This article by Simply Wall St is general in nature. We provide commentary based on historical data and analyst forecasts only using an unbiased methodology and our articles are not intended to be financial advice. It does not constitute a recommendation to buy or sell any stock, and does not take account of your objectives, or your financial situation. We aim to bring you long-term focused analysis driven by fundamental data. Note that our analysis may not factor in the latest price-sensitive company announcements or qualitative material. Simply Wall St has no position in any stocks mentioned.
About TSE:4390
IPS
Provides IT and telecommunications services in Japan and the Philippines.
Reasonable growth potential with proven track record.
Similar Companies
Market Insights

Advertisement
Community Narratives
MicroVision will explode future revenue by 380.37% with a vision towards success
Fair Value US$60.00|98.4% undervalued
TH
Community Contributor
The Indispensable Artery for a New North American Economy
Fair Value CA$132.87|1.3% undervalued
TI
Community Contributor