- Japan
- /
- Electronic Equipment and Components
- /
- TSE:7746
A Closer Look At Okamoto Glass Co., Ltd.'s (TSE:7746) Uninspiring ROE


One of the best investments we can make is in our own knowledge and skill set. With that in mind, this article will work through how we can use Return On Equity (ROE) to better understand a business. We'll use ROE to examine Okamoto Glass Co., Ltd. (TSE:7746), by way of a worked example.
ROE or return on equity is a useful tool to assess how effectively a company can generate returns on the investment it received from its shareholders. Put another way, it reveals the company's success at turning shareholder investments into profits.
View our latest analysis for Okamoto Glass
How Do You Calculate Return On Equity?
ROE can be calculated by using the formula:
Return on Equity = Net Profit (from continuing operations) ÷ Shareholders' Equity
So, based on the above formula, the ROE for Okamoto Glass is:
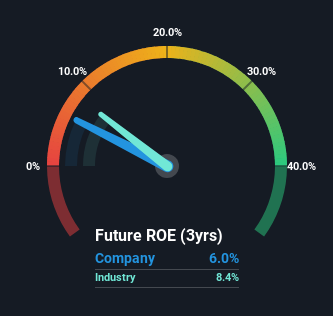
6.0% = JP¥101m ÷ JP¥1.7b (Based on the trailing twelve months to March 2024).
The 'return' is the yearly profit. Another way to think of that is that for every ¥1 worth of equity, the company was able to earn ¥0.06 in profit.
Does Okamoto Glass Have A Good ROE?
Arguably the easiest way to assess company's ROE is to compare it with the average in its industry. However, this method is only useful as a rough check, because companies do differ quite a bit within the same industry classification. As shown in the graphic below, Okamoto Glass has a lower ROE than the average (8.4%) in the Electronic industry classification.
That's not what we like to see. However, a low ROE is not always bad. If the company's debt levels are moderate to low, then there's still a chance that returns can be improved via the use of financial leverage. When a company has low ROE but high debt levels, we would be cautious as the risk involved is too high. You can see the 3 risks we have identified for Okamoto Glass by visiting our risks dashboard for free on our platform here.
How Does Debt Impact ROE?
Virtually all companies need money to invest in the business, to grow profits. That cash can come from retained earnings, issuing new shares (equity), or debt. In the case of the first and second options, the ROE will reflect this use of cash, for growth. In the latter case, the debt required for growth will boost returns, but will not impact the shareholders' equity. That will make the ROE look better than if no debt was used.
Okamoto Glass' Debt And Its 6.0% ROE
We think Okamoto Glass uses a significant amount of debt to maximize its returns, as it has a significantly higher debt to equity ratio of 3.08. The combination of a rather low ROE and high debt to equity is a negative, in our book.
Summary
Return on equity is one way we can compare its business quality of different companies. A company that can achieve a high return on equity without debt could be considered a high quality business. If two companies have around the same level of debt to equity, and one has a higher ROE, I'd generally prefer the one with higher ROE.
But ROE is just one piece of a bigger puzzle, since high quality businesses often trade on high multiples of earnings. The rate at which profits are likely to grow, relative to the expectations of profit growth reflected in the current price, must be considered, too. You can see how the company has grow in the past by looking at this FREE detailed graph of past earnings, revenue and cash flow.
If you would prefer check out another company -- one with potentially superior financials -- then do not miss this free list of interesting companies, that have HIGH return on equity and low debt.
New: AI Stock Screener & Alerts
Our new AI Stock Screener scans the market every day to uncover opportunities.
• Dividend Powerhouses (3%+ Yield)
• Undervalued Small Caps with Insider Buying
• High growth Tech and AI Companies
Or build your own from over 50 metrics.
Have feedback on this article? Concerned about the content? Get in touch with us directly. Alternatively, email editorial-team (at) simplywallst.com.
This article by Simply Wall St is general in nature. We provide commentary based on historical data and analyst forecasts only using an unbiased methodology and our articles are not intended to be financial advice. It does not constitute a recommendation to buy or sell any stock, and does not take account of your objectives, or your financial situation. We aim to bring you long-term focused analysis driven by fundamental data. Note that our analysis may not factor in the latest price-sensitive company announcements or qualitative material. Simply Wall St has no position in any stocks mentioned.
Have feedback on this article? Concerned about the content? Get in touch with us directly. Alternatively, email editorial-team@simplywallst.com
About TSE:7746
Okamoto Glass
Manufactures and sells special-purpose glass for industrial use and multi-layer film evaporation products.
Low with questionable track record.
