
Advertisement
- Japan
- /
- Professional Services
- /
- TSE:7781
Will Weakness in HIRAYAMA HOLDINGS Co.,Ltd.'s (TSE:7781) Stock Prove Temporary Given Strong Fundamentals?
HIRAYAMA HOLDINGSLtd (TSE:7781) has had a rough three months with its share price down 33%. However, stock prices are usually driven by a company’s financial performance over the long term, which in this case looks quite promising. Specifically, we decided to study HIRAYAMA HOLDINGSLtd's ROE in this article.
Return on Equity or ROE is a test of how effectively a company is growing its value and managing investors’ money. In simpler terms, it measures the profitability of a company in relation to shareholder's equity.
View our latest analysis for HIRAYAMA HOLDINGSLtd
How Do You Calculate Return On Equity?
ROE can be calculated by using the formula:
Return on Equity = Net Profit (from continuing operations) ÷ Shareholders' Equity
So, based on the above formula, the ROE for HIRAYAMA HOLDINGSLtd is:
15% = JP¥627m ÷ JP¥4.3b (Based on the trailing twelve months to March 2024).
The 'return' refers to a company's earnings over the last year. One way to conceptualize this is that for each ¥1 of shareholders' capital it has, the company made ¥0.15 in profit.
Why Is ROE Important For Earnings Growth?
We have already established that ROE serves as an efficient profit-generating gauge for a company's future earnings. Depending on how much of these profits the company reinvests or "retains", and how effectively it does so, we are then able to assess a company’s earnings growth potential. Generally speaking, other things being equal, firms with a high return on equity and profit retention, have a higher growth rate than firms that don’t share these attributes.
A Side By Side comparison of HIRAYAMA HOLDINGSLtd's Earnings Growth And 15% ROE
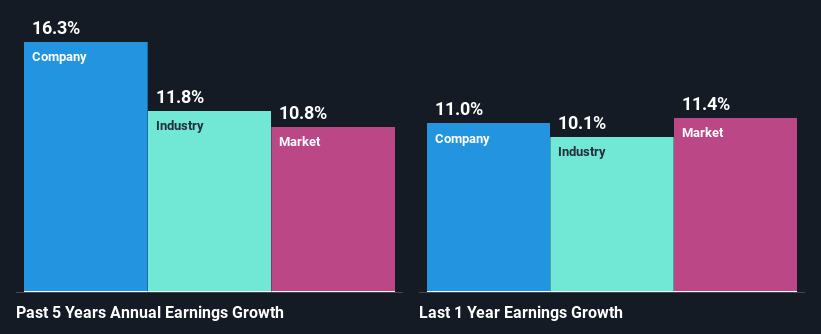
At first glance, HIRAYAMA HOLDINGSLtd seems to have a decent ROE. Even when compared to the industry average of 13% the company's ROE looks quite decent. This certainly adds some context to HIRAYAMA HOLDINGSLtd's moderate 16% net income growth seen over the past five years.
Next, on comparing with the industry net income growth, we found that HIRAYAMA HOLDINGSLtd's growth is quite high when compared to the industry average growth of 12% in the same period, which is great to see.
Earnings growth is a huge factor in stock valuation. The investor should try to establish if the expected growth or decline in earnings, whichever the case may be, is priced in. Doing so will help them establish if the stock's future looks promising or ominous. One good indicator of expected earnings growth is the P/E ratio which determines the price the market is willing to pay for a stock based on its earnings prospects. So, you may want to check if HIRAYAMA HOLDINGSLtd is trading on a high P/E or a low P/E, relative to its industry.
Is HIRAYAMA HOLDINGSLtd Efficiently Re-investing Its Profits?
HIRAYAMA HOLDINGSLtd has a low three-year median payout ratio of 25%, meaning that the company retains the remaining 75% of its profits. This suggests that the management is reinvesting most of the profits to grow the business.
Moreover, HIRAYAMA HOLDINGSLtd is determined to keep sharing its profits with shareholders which we infer from its long history of nine years of paying a dividend.
Conclusion
On the whole, we feel that HIRAYAMA HOLDINGSLtd's performance has been quite good. Particularly, we like that the company is reinvesting heavily into its business, and at a high rate of return. Unsurprisingly, this has led to an impressive earnings growth. If the company continues to grow its earnings the way it has, that could have a positive impact on its share price given how earnings per share influence long-term share prices. Not to forget, share price outcomes are also dependent on the potential risks a company may face. So it is important for investors to be aware of the risks involved in the business. Our risks dashboard would have the 2 risks we have identified for HIRAYAMA HOLDINGSLtd.
Valuation is complex, but we're here to simplify it.
Discover if HIRAYAMA HOLDINGSLtd might be undervalued or overvalued with our detailed analysis, featuring fair value estimates, potential risks, dividends, insider trades, and its financial condition.
Access Free AnalysisHave feedback on this article? Concerned about the content? Get in touch with us directly. Alternatively, email editorial-team (at) simplywallst.com.
This article by Simply Wall St is general in nature. We provide commentary based on historical data and analyst forecasts only using an unbiased methodology and our articles are not intended to be financial advice. It does not constitute a recommendation to buy or sell any stock, and does not take account of your objectives, or your financial situation. We aim to bring you long-term focused analysis driven by fundamental data. Note that our analysis may not factor in the latest price-sensitive company announcements or qualitative material. Simply Wall St has no position in any stocks mentioned.
Have feedback on this article? Concerned about the content? Get in touch with us directly. Alternatively, email editorial-team@simplywallst.com
About TSE:7781
HIRAYAMA HOLDINGSLtd
Provides human resources services and contract work primarily for the manufacturing and technology development departments of manufacturing companies in Japan and internationally.
Flawless balance sheet with solid track record and pays a dividend.
Market Insights

Advertisement
Community Narratives
MicroVision will explode future revenue by 380.37% with a vision towards success
Fair Value US$60|98.4% undervalued
TH
Community Contributor
The Indispensable Artery for a New North American Economy
Fair Value CA$132.87|1.6% undervalued
TI
Community Contributor
Recently Updated Narratives
BE


Bejgal on MINISO Group Holding ·
MINISO's fair value is projected at 26.69 with an anticipated PE ratio shift of 20x
Fair Value:US$26.6928.0% undervalued
44 followersusers have followed this narrative
3 commentsusers have commented on this narrative
0 likesusers have liked this narrative
TI


TickerTickle on Oracle ·
The Quiet Giant That Became AI’s Power Grid
Fair Value:US$389.8149.5% undervalued
7 followersusers have followed this narrative
1 commentusers have commented on this narrative
0 likesusers have liked this narrative
AU

AuCA on Nova Ljubljanska Banka d.d ·
Nova Ljubljanska Banka d.d will expect a 11.2% revenue boost driving future growth
Fair Value:€20916.5% undervalued
23 followersusers have followed this narrative
3 commentsusers have commented on this narrative
0 likesusers have liked this narrative
Popular Narratives
OS


oscargarcia on Alphabet ·
The company that turned a verb into a global necessity and basically runs the modern internet, digital ads, smartphones, maps, and AI.
Fair Value:US$3404.9% undervalued
136 followersusers have followed this narrative
6 commentsusers have commented on this narrative
18 likesusers have liked this narrative
TH

TheWallstreetKing on MicroVision ·
MicroVision will explode future revenue by 380.37% with a vision towards success
Fair Value:US$6098.4% undervalued
88 followersusers have followed this narrative
11 commentsusers have commented on this narrative
18 likesusers have liked this narrative
AN


AnalystConsensusTarget on NVIDIA ·
NVDA: Expanding AI Demand Will Drive Major Data Center Investments Through 2026
Fair Value:US$232.7923.6% undervalued
926 followersusers have followed this narrative
6 commentsusers have commented on this narrative
22 likesusers have liked this narrative