- Japan
- /
- Electronic Equipment and Components
- /
- TSE:7213
Earnings growth of 3.8% over 5 years hasn't been enough to translate into positive returns for Lecip Holdings (TSE:7213) shareholders


In order to justify the effort of selecting individual stocks, it's worth striving to beat the returns from a market index fund. But every investor is virtually certain to have both over-performing and under-performing stocks. So we wouldn't blame long term Lecip Holdings Corporation (TSE:7213) shareholders for doubting their decision to hold, with the stock down 25% over a half decade. Furthermore, it's down 20% in about a quarter. That's not much fun for holders.
After losing 12% this past week, it's worth investigating the company's fundamentals to see what we can infer from past performance.
Check out our latest analysis for Lecip Holdings
There is no denying that markets are sometimes efficient, but prices do not always reflect underlying business performance. One imperfect but simple way to consider how the market perception of a company has shifted is to compare the change in the earnings per share (EPS) with the share price movement.
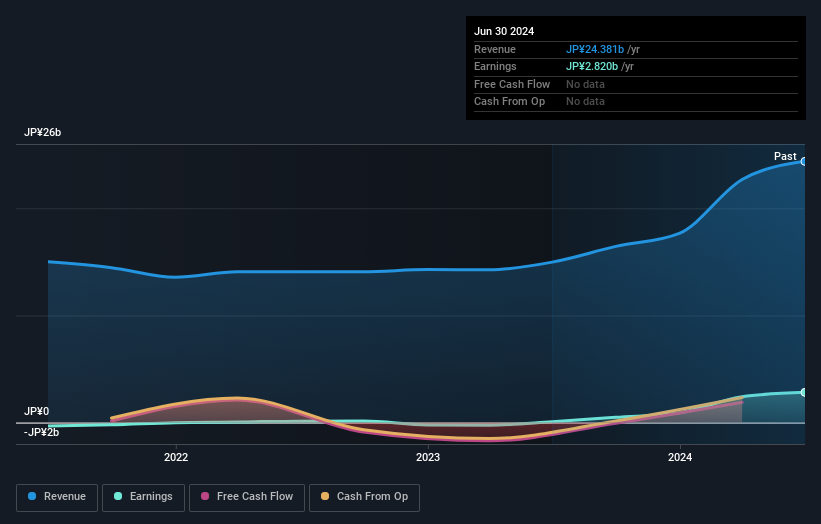
During five years of share price growth, Lecip Holdings moved from a loss to profitability. That would generally be considered a positive, so we are surprised to see the share price is down. Other metrics might give us a better handle on how its value is changing over time.
We don't think that the 1.6% is big factor in the share price, since it's quite small, as dividends go. Arguably, the revenue drop of 7.3% a year for half a decade suggests that the company can't grow in the long term. This has probably encouraged some shareholders to sell down the stock.
The company's revenue and earnings (over time) are depicted in the image below (click to see the exact numbers).
Take a more thorough look at Lecip Holdings' financial health with this free report on its balance sheet.
What About Dividends?
When looking at investment returns, it is important to consider the difference between total shareholder return (TSR) and share price return. The TSR incorporates the value of any spin-offs or discounted capital raisings, along with any dividends, based on the assumption that the dividends are reinvested. Arguably, the TSR gives a more comprehensive picture of the return generated by a stock. In the case of Lecip Holdings, it has a TSR of -20% for the last 5 years. That exceeds its share price return that we previously mentioned. The dividends paid by the company have thusly boosted the total shareholder return.
A Different Perspective
Lecip Holdings shareholders gained a total return of 0.8% during the year. But that was short of the market average. But at least that's still a gain! Over five years the TSR has been a reduction of 4% per year, over five years. It could well be that the business is stabilizing. While it is well worth considering the different impacts that market conditions can have on the share price, there are other factors that are even more important. Even so, be aware that Lecip Holdings is showing 2 warning signs in our investment analysis , you should know about...
If you like to buy stocks alongside management, then you might just love this free list of companies. (Hint: many of them are unnoticed AND have attractive valuation).
Please note, the market returns quoted in this article reflect the market weighted average returns of stocks that currently trade on Japanese exchanges.
New: AI Stock Screener & Alerts
Our new AI Stock Screener scans the market every day to uncover opportunities.
• Dividend Powerhouses (3%+ Yield)
• Undervalued Small Caps with Insider Buying
• High growth Tech and AI Companies
Or build your own from over 50 metrics.
Have feedback on this article? Concerned about the content? Get in touch with us directly. Alternatively, email editorial-team (at) simplywallst.com.
This article by Simply Wall St is general in nature. We provide commentary based on historical data and analyst forecasts only using an unbiased methodology and our articles are not intended to be financial advice. It does not constitute a recommendation to buy or sell any stock, and does not take account of your objectives, or your financial situation. We aim to bring you long-term focused analysis driven by fundamental data. Note that our analysis may not factor in the latest price-sensitive company announcements or qualitative material. Simply Wall St has no position in any stocks mentioned.
About TSE:7213
Lecip Holdings
Plans, designs, manufactures, and sells lighting, electric power conversion, and information processing equipment for buses, trains, automobiles, and industrial equipment in Japan and internationally.
Outstanding track record with flawless balance sheet.

