Advertisement
- Japan
- /
- Electronic Equipment and Components
- /
- TSE:6856
A Fresh Look at HORIBA (TSE:6856) Valuation Following a 15% Share Price Surge

Simply Wall St
Reviewed by Simply Wall St
HORIBA (TSE:6856) shares have gained solid ground over the past month, rising more than 15%. This move comes as investors eye the company’s consistent revenue and profit growth, along with an impressive one-year return of 84%.
See our latest analysis for HORIBA.
After notching up a hefty 12% share price gain in a single day, HORIBA is clearly attracting fresh attention from investors, building on strong recent momentum. The stock’s impressive 84% one-year total shareholder return, along with a 61% year-to-date share price increase, reflects a powerful run that has rewarded both short- and long-term holders.
If this renewed interest in fast-moving companies has you curious, consider taking the next step and discover fast growing stocks with high insider ownership
But with shares soaring in recent months, is there still hidden value left to unlock in HORIBA, or has the market already anticipated further growth and priced it in? Could now be a genuine buying opportunity?
Price-to-Earnings of 16.9x: Is it justified?
HORIBA's shares currently trade at a price-to-earnings (P/E) ratio of 16.9x, notably higher than both its peer group and the broader industry. This suggests investors are paying a premium for its earnings relative to similar companies.
The P/E ratio compares a company’s share price to its earnings per share, providing a quick measure of market expectation for profit growth. For technology manufacturing businesses like HORIBA, this metric is crucial, as it reflects sentiment around both stable earnings and future opportunity.
In HORIBA’s case, the market appears to be placing a higher value on the company’s recent performance and potential earnings growth. However, this premium is hard to ignore when you realize the average P/E for peers and the JP Electronic sector is just 14.7x. Compared to its estimated fair P/E ratio of 18.7x, however, the current multiple is below what regression analysis suggests as a rational level. This suggests some room for re-rating if the narrative holds up.
Explore the SWS fair ratio for HORIBA
Result: Price-to-Earnings of 16.9x (OVERVALUED)
However, risks remain if growth slows or if the current premium proves unsustainable. This could prompt a swift reversal in investor sentiment.
Find out about the key risks to this HORIBA narrative.
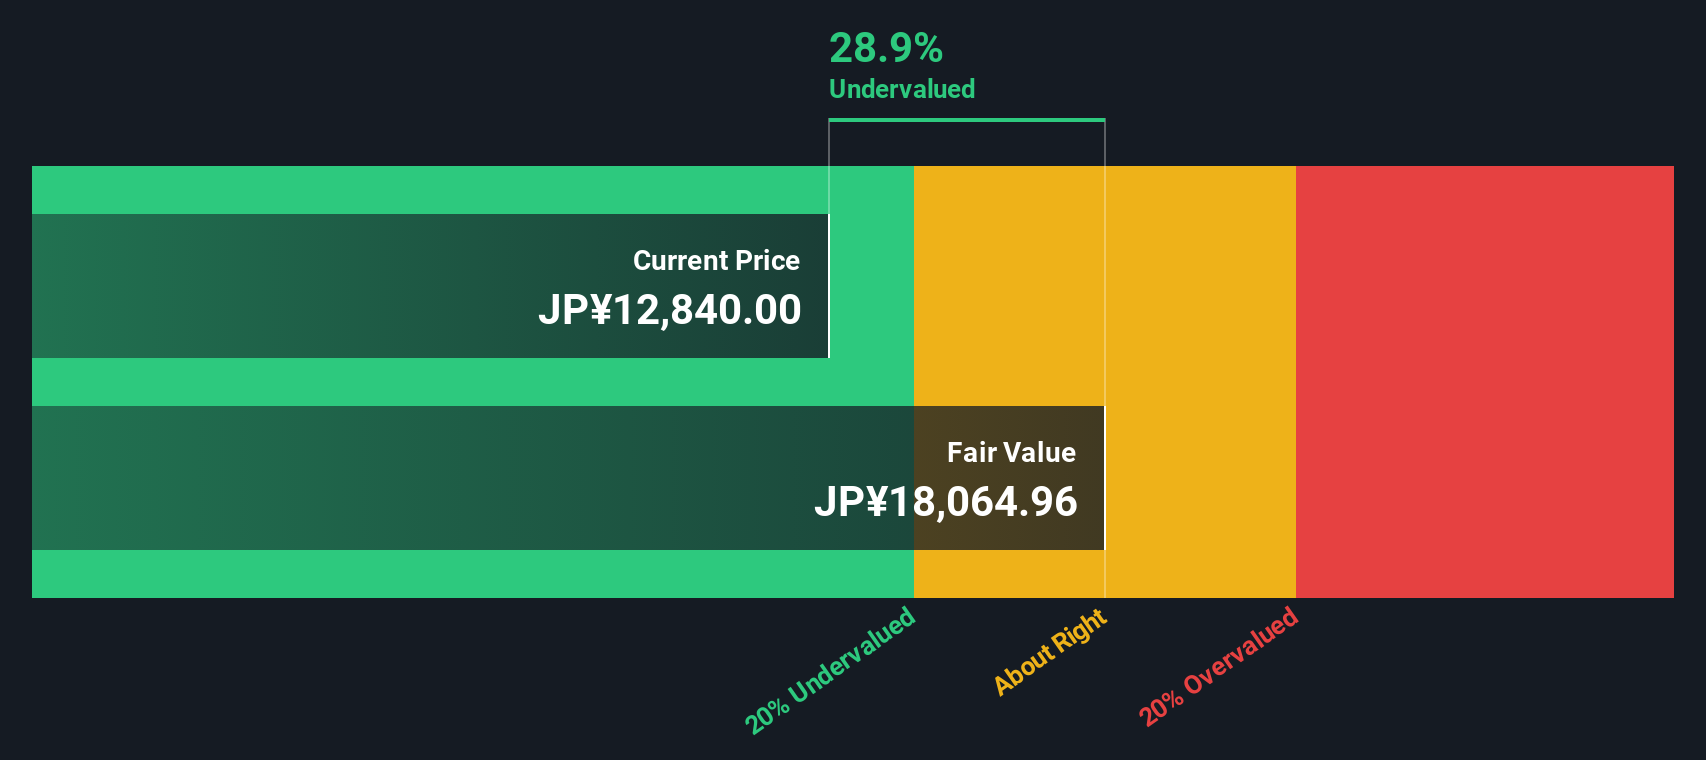
Another View: Discounted Cash Flow Suggests Undervaluation
Taking a different perspective, our DCF model values HORIBA at ¥18,079 per share. This is significantly higher than its current market price of ¥14,610, suggesting the stock may be undervalued by nearly 19%. Could this be where value-oriented investors find their edge?
Look into how the SWS DCF model arrives at its fair value.
Simply Wall St performs a discounted cash flow (DCF) on every stock in the world every day (check out HORIBA for example). We show the entire calculation in full. You can track the result in your watchlist or portfolio and be alerted when this changes, or use our stock screener to discover 906 undervalued stocks based on their cash flows. If you save a screener we even alert you when new companies match - so you never miss a potential opportunity.
Build Your Own HORIBA Narrative
If you see the numbers differently or want to investigate on your own terms, you can easily craft your own perspective in just a few minutes. Do it your way
A great starting point for your HORIBA research is our analysis highlighting 3 key rewards and 1 important warning sign that could impact your investment decision.
Looking for more investment ideas?
Opportunity does not wait. Smart investors are always one step ahead. Uncover fresh possibilities and gain an edge using these powerful stock screens from Simply Wall Street:
- Capitalize on innovation and stay ahead of tech trends by starting your search with these 26 AI penny stocks.
- Benefit from attractive yields and steady income through these 16 dividend stocks with yields > 3%, focusing on strong dividend payers with solid fundamentals.
- Unlock opportunities in companies trading below their intrinsic value when you use these 906 undervalued stocks based on cash flows to spot hidden gems others might miss.
This article by Simply Wall St is general in nature. We provide commentary based on historical data and analyst forecasts only using an unbiased methodology and our articles are not intended to be financial advice. It does not constitute a recommendation to buy or sell any stock, and does not take account of your objectives, or your financial situation. We aim to bring you long-term focused analysis driven by fundamental data. Note that our analysis may not factor in the latest price-sensitive company announcements or qualitative material. Simply Wall St has no position in any stocks mentioned.
Valuation is complex, but we're here to simplify it.
Discover if HORIBA might be undervalued or overvalued with our detailed analysis, featuring fair value estimates, potential risks, dividends, insider trades, and its financial condition.
Access Free AnalysisHave feedback on this article? Concerned about the content? Get in touch with us directly. Alternatively, email editorial-team@simplywallst.com
About TSE:6856
HORIBA
Provides analytical and measurement solutions in Japan and internationally.
Flawless balance sheet average dividend payer.
Similar Companies
Market Insights

Advertisement
Community Narratives
MINISO's fair value is projected at 26.69 with an anticipated PE ratio shift of 20x
Fair Value US$24.03|11.0% undervalued
BE
Community Contributor
Procter & Gamble: A Dividend Giant Facing Slowing Growth
Fair Value US$119.81|23.3% overvalued
AN
Community Contributor
Eli Lilly's Future Growth Driven by Tirzepatide and Favorable Market Conditions
Fair Value US$1.19k|13.8% undervalued
EA
Community Contributor