
Advertisement
- Japan
- /
- Electronic Equipment and Components
- /
- TSE:6806
Hirose Electric Co.,Ltd.'s (TSE:6806) Intrinsic Value Is Potentially 23% Below Its Share Price
Key Insights
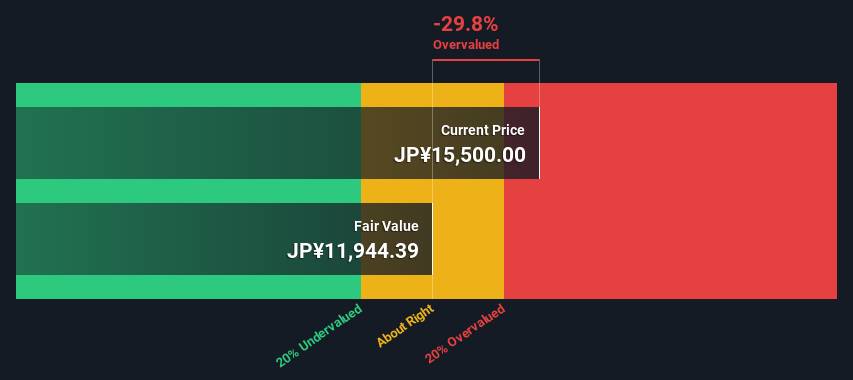
- Hirose ElectricLtd's estimated fair value is JP¥11,944 based on 2 Stage Free Cash Flow to Equity
- Hirose ElectricLtd's JP¥15,500 share price signals that it might be 30% overvalued
- The JP¥18,075 analyst price target for 6806 is 51% more than our estimate of fair value
Today we will run through one way of estimating the intrinsic value of Hirose Electric Co.,Ltd. (TSE:6806) by taking the expected future cash flows and discounting them to their present value. We will use the Discounted Cash Flow (DCF) model on this occasion. Models like these may appear beyond the comprehension of a lay person, but they're fairly easy to follow.
Remember though, that there are many ways to estimate a company's value, and a DCF is just one method. If you want to learn more about discounted cash flow, the rationale behind this calculation can be read in detail in the Simply Wall St analysis model.
Check out our latest analysis for Hirose ElectricLtd
The Method
We use what is known as a 2-stage model, which simply means we have two different periods of growth rates for the company's cash flows. Generally the first stage is higher growth, and the second stage is a lower growth phase. In the first stage we need to estimate the cash flows to the business over the next ten years. Where possible we use analyst estimates, but when these aren't available we extrapolate the previous free cash flow (FCF) from the last estimate or reported value. We assume companies with shrinking free cash flow will slow their rate of shrinkage, and that companies with growing free cash flow will see their growth rate slow, over this period. We do this to reflect that growth tends to slow more in the early years than it does in later years.
A DCF is all about the idea that a dollar in the future is less valuable than a dollar today, so we discount the value of these future cash flows to their estimated value in today's dollars:
10-year free cash flow (FCF) estimate
| 2024 | 2025 | 2026 | 2027 | 2028 | 2029 | 2030 | 2031 | 2032 | 2033 | |
| Levered FCF (¥, Millions) | JP¥21.6b | JP¥30.7b | JP¥28.4b | JP¥27.1b | JP¥26.2b | JP¥25.6b | JP¥25.2b | JP¥24.9b | JP¥24.8b | JP¥24.7b |
| Growth Rate Estimate Source | Analyst x2 | Analyst x5 | Analyst x4 | Est @ -4.79% | Est @ -3.31% | Est @ -2.27% | Est @ -1.54% | Est @ -1.03% | Est @ -0.67% | Est @ -0.42% |
| Present Value (¥, Millions) Discounted @ 6.3% | JP¥20.3k | JP¥27.1k | JP¥23.6k | JP¥21.2k | JP¥19.2k | JP¥17.7k | JP¥16.4k | JP¥15.2k | JP¥14.2k | JP¥13.3k |
("Est" = FCF growth rate estimated by Simply Wall St)
Present Value of 10-year Cash Flow (PVCF) = JP¥188b
We now need to calculate the Terminal Value, which accounts for all the future cash flows after this ten year period. The Gordon Growth formula is used to calculate Terminal Value at a future annual growth rate equal to the 5-year average of the 10-year government bond yield of 0.2%. We discount the terminal cash flows to today's value at a cost of equity of 6.3%.
Terminal Value (TV)= FCF2033 × (1 + g) ÷ (r – g) = JP¥25b× (1 + 0.2%) ÷ (6.3%– 0.2%) = JP¥399b
Present Value of Terminal Value (PVTV)= TV / (1 + r)10= JP¥399b÷ ( 1 + 6.3%)10= JP¥216b
The total value, or equity value, is then the sum of the present value of the future cash flows, which in this case is JP¥404b. In the final step we divide the equity value by the number of shares outstanding. Relative to the current share price of JP¥16k, the company appears slightly overvalued at the time of writing. The assumptions in any calculation have a big impact on the valuation, so it is better to view this as a rough estimate, not precise down to the last cent.
The Assumptions
We would point out that the most important inputs to a discounted cash flow are the discount rate and of course the actual cash flows. Part of investing is coming up with your own evaluation of a company's future performance, so try the calculation yourself and check your own assumptions. The DCF also does not consider the possible cyclicality of an industry, or a company's future capital requirements, so it does not give a full picture of a company's potential performance. Given that we are looking at Hirose ElectricLtd as potential shareholders, the cost of equity is used as the discount rate, rather than the cost of capital (or weighted average cost of capital, WACC) which accounts for debt. In this calculation we've used 6.3%, which is based on a levered beta of 1.099. Beta is a measure of a stock's volatility, compared to the market as a whole. We get our beta from the industry average beta of globally comparable companies, with an imposed limit between 0.8 and 2.0, which is a reasonable range for a stable business.
SWOT Analysis for Hirose ElectricLtd
Strength
- Currently debt free.
Weakness
- Earnings declined over the past year.
- Dividend is low compared to the top 25% of dividend payers in the Electronic market.
- Expensive based on P/E ratio and estimated fair value.
Opportunity
- Annual earnings are forecast to grow faster than the Japanese market.
Threat
- Dividends are not covered by cash flow.
- Revenue is forecast to grow slower than 20% per year.
Next Steps:
Whilst important, the DCF calculation shouldn't be the only metric you look at when researching a company. The DCF model is not a perfect stock valuation tool. Rather it should be seen as a guide to "what assumptions need to be true for this stock to be under/overvalued?" If a company grows at a different rate, or if its cost of equity or risk free rate changes sharply, the output can look very different. Why is the intrinsic value lower than the current share price? For Hirose ElectricLtd, we've compiled three relevant items you should further examine:
- Risks: Consider for instance, the ever-present spectre of investment risk. We've identified 1 warning sign with Hirose ElectricLtd , and understanding this should be part of your investment process.
- Future Earnings: How does 6806's growth rate compare to its peers and the wider market? Dig deeper into the analyst consensus number for the upcoming years by interacting with our free analyst growth expectation chart.
- Other High Quality Alternatives: Do you like a good all-rounder? Explore our interactive list of high quality stocks to get an idea of what else is out there you may be missing!
PS. The Simply Wall St app conducts a discounted cash flow valuation for every stock on the TSE every day. If you want to find the calculation for other stocks just search here.
Valuation is complex, but we're here to simplify it.
Discover if Hirose ElectricLtd might be undervalued or overvalued with our detailed analysis, featuring fair value estimates, potential risks, dividends, insider trades, and its financial condition.
Access Free AnalysisHave feedback on this article? Concerned about the content? Get in touch with us directly. Alternatively, email editorial-team (at) simplywallst.com.
This article by Simply Wall St is general in nature. We provide commentary based on historical data and analyst forecasts only using an unbiased methodology and our articles are not intended to be financial advice. It does not constitute a recommendation to buy or sell any stock, and does not take account of your objectives, or your financial situation. We aim to bring you long-term focused analysis driven by fundamental data. Note that our analysis may not factor in the latest price-sensitive company announcements or qualitative material. Simply Wall St has no position in any stocks mentioned.
About TSE:6806
Hirose ElectricLtd
Manufactures and sells connectors and other electronic components in Japan, China, South Korea, and internationally.
Flawless balance sheet with proven track record and pays a dividend.
Similar Companies
Market Insights

Advertisement
Community Narratives
Finding The True Value Of A Logistics Powerhouse
Fair Value US$95.21|8.6% undervalued
NV
Community Contributor
Paradigm Biopharmaceuticals Will Lead Osteoarthritis Treatment with Zilosul's FDA Success
Fair Value AU$5.50|91.9% undervalued
AM
Community Contributor
Barrick Mining (ABX:CA): A Gold Hedge against a U.S. Shutdown
Fair Value CA$60.00|25.6% undervalued
GM
Community Contributor