- Japan
- /
- Electronic Equipment and Components
- /
- TSE:6800
Does Yokowo (TSE:6800) Have A Healthy Balance Sheet?

David Iben put it well when he said, 'Volatility is not a risk we care about. What we care about is avoiding the permanent loss of capital.' So it might be obvious that you need to consider debt, when you think about how risky any given stock is, because too much debt can sink a company. As with many other companies Yokowo Co., Ltd. (TSE:6800) makes use of debt. But the more important question is: how much risk is that debt creating?
What Risk Does Debt Bring?
Debt assists a business until the business has trouble paying it off, either with new capital or with free cash flow. In the worst case scenario, a company can go bankrupt if it cannot pay its creditors. However, a more frequent (but still costly) occurrence is where a company must issue shares at bargain-basement prices, permanently diluting shareholders, just to shore up its balance sheet. Having said that, the most common situation is where a company manages its debt reasonably well - and to its own advantage. When we think about a company's use of debt, we first look at cash and debt together.
View our latest analysis for Yokowo
What Is Yokowo's Net Debt?
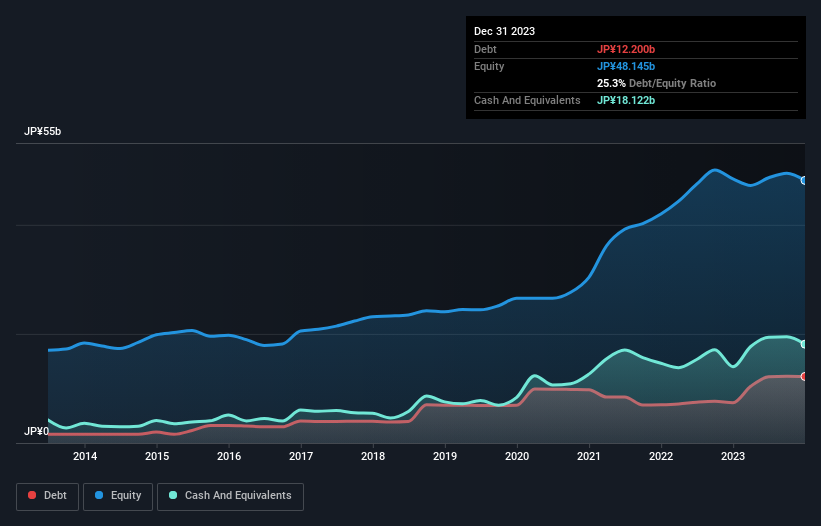
As you can see below, at the end of December 2023, Yokowo had JP¥12.2b of debt, up from JP¥7.39b a year ago. Click the image for more detail. But on the other hand it also has JP¥18.1b in cash, leading to a JP¥5.92b net cash position.
How Strong Is Yokowo's Balance Sheet?
According to the last reported balance sheet, Yokowo had liabilities of JP¥19.4b due within 12 months, and liabilities of JP¥7.54b due beyond 12 months. Offsetting this, it had JP¥18.1b in cash and JP¥12.7b in receivables that were due within 12 months. So it actually has JP¥3.83b more liquid assets than total liabilities.
This short term liquidity is a sign that Yokowo could probably pay off its debt with ease, as its balance sheet is far from stretched. Simply put, the fact that Yokowo has more cash than debt is arguably a good indication that it can manage its debt safely.
The modesty of its debt load may become crucial for Yokowo if management cannot prevent a repeat of the 94% cut to EBIT over the last year. Falling earnings (if the trend continues) could eventually make even modest debt quite risky. There's no doubt that we learn most about debt from the balance sheet. But ultimately the future profitability of the business will decide if Yokowo can strengthen its balance sheet over time. So if you want to see what the professionals think, you might find this free report on analyst profit forecasts to be interesting.
Finally, while the tax-man may adore accounting profits, lenders only accept cold hard cash. While Yokowo has net cash on its balance sheet, it's still worth taking a look at its ability to convert earnings before interest and tax (EBIT) to free cash flow, to help us understand how quickly it is building (or eroding) that cash balance. Over the last three years, Yokowo reported free cash flow worth 6.7% of its EBIT, which is really quite low. For us, cash conversion that low sparks a little paranoia about is ability to extinguish debt.
Summing Up
While we empathize with investors who find debt concerning, you should keep in mind that Yokowo has net cash of JP¥5.92b, as well as more liquid assets than liabilities. So although we see some areas for improvement, we're not too worried about Yokowo's balance sheet. When analysing debt levels, the balance sheet is the obvious place to start. But ultimately, every company can contain risks that exist outside of the balance sheet. To that end, you should be aware of the 1 warning sign we've spotted with Yokowo .
If, after all that, you're more interested in a fast growing company with a rock-solid balance sheet, then check out our list of net cash growth stocks without delay.
The New Payments ETF Is Live on NASDAQ:
Money is moving to real-time rails, and a newly listed ETF now gives investors direct exposure. Fast settlement. Institutional custody. Simple access.
Explore how this launch could reshape portfolios
Sponsored ContentNew: Manage All Your Stock Portfolios in One Place
We've created the ultimate portfolio companion for stock investors, and it's free.
• Connect an unlimited number of Portfolios and see your total in one currency
• Be alerted to new Warning Signs or Risks via email or mobile
• Track the Fair Value of your stocks
Have feedback on this article? Concerned about the content? Get in touch with us directly. Alternatively, email editorial-team (at) simplywallst.com.
This article by Simply Wall St is general in nature. We provide commentary based on historical data and analyst forecasts only using an unbiased methodology and our articles are not intended to be financial advice. It does not constitute a recommendation to buy or sell any stock, and does not take account of your objectives, or your financial situation. We aim to bring you long-term focused analysis driven by fundamental data. Note that our analysis may not factor in the latest price-sensitive company announcements or qualitative material. Simply Wall St has no position in any stocks mentioned.
About TSE:6800
Yokowo
Provides components and advanced devices for wireless communication and information transmission applications in Japan, Europe, Asia, and the United States.
Flawless balance sheet established dividend payer.
Similar Companies
Market Insights

Weekly Picks

Early mover in a fast growing industry. Likely to experience share price volatility as they scale


A case for CA$31.80 (undiluted), aka 8,616% upside from CA$0.37 (an 86 bagger!).


Moderation and Stabilisation: HOLD: Fair Price based on a 4-year Cycle is $12.08
Recently Updated Narratives

Airbnb Stock: Platform Growth in a World of Saturation and Scrutiny

Clarivate Stock: When Data Becomes the Backbone of Innovation and Law

Adobe Stock: AI-Fueled ARR Growth Pushes Guidance Higher, But Cost Pressures Loom
Popular Narratives


Crazy Undervalued 42 Baggers Silver Play (Active & Running Mine)


NVDA: Expanding AI Demand Will Drive Major Data Center Investments Through 2026


MicroVision will explode future revenue by 380.37% with a vision towards success
Trending Discussion
