- Japan
- /
- Electronic Equipment and Components
- /
- TSE:6775
Is TB Group (TSE:6775) Weighed On By Its Debt Load?

Howard Marks put it nicely when he said that, rather than worrying about share price volatility, 'The possibility of permanent loss is the risk I worry about... and every practical investor I know worries about.' So it seems the smart money knows that debt - which is usually involved in bankruptcies - is a very important factor, when you assess how risky a company is. We note that TB Group Inc. (TSE:6775) does have debt on its balance sheet. But is this debt a concern to shareholders?
What Risk Does Debt Bring?
Debt is a tool to help businesses grow, but if a business is incapable of paying off its lenders, then it exists at their mercy. In the worst case scenario, a company can go bankrupt if it cannot pay its creditors. However, a more frequent (but still costly) occurrence is where a company must issue shares at bargain-basement prices, permanently diluting shareholders, just to shore up its balance sheet. By replacing dilution, though, debt can be an extremely good tool for businesses that need capital to invest in growth at high rates of return. The first step when considering a company's debt levels is to consider its cash and debt together.
Check out our latest analysis for TB Group
What Is TB Group's Debt?
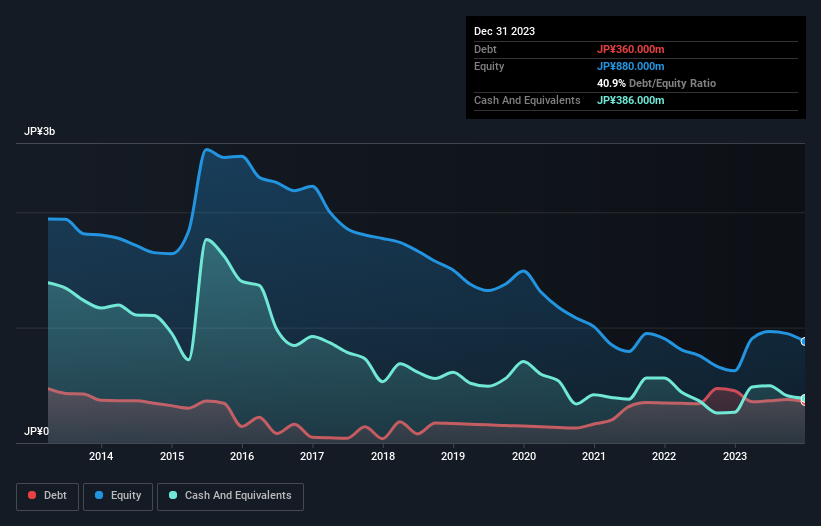
As you can see below, TB Group had JP¥360.0m of debt at December 2023, down from JP¥453.0m a year prior. However, its balance sheet shows it holds JP¥386.0m in cash, so it actually has JP¥26.0m net cash.
How Strong Is TB Group's Balance Sheet?
We can see from the most recent balance sheet that TB Group had liabilities of JP¥406.0m falling due within a year, and liabilities of JP¥340.0m due beyond that. On the other hand, it had cash of JP¥386.0m and JP¥154.0m worth of receivables due within a year. So its liabilities total JP¥206.0m more than the combination of its cash and short-term receivables.
Since publicly traded TB Group shares are worth a total of JP¥2.49b, it seems unlikely that this level of liabilities would be a major threat. However, we do think it is worth keeping an eye on its balance sheet strength, as it may change over time. While it does have liabilities worth noting, TB Group also has more cash than debt, so we're pretty confident it can manage its debt safely. When analysing debt levels, the balance sheet is the obvious place to start. But you can't view debt in total isolation; since TB Group will need earnings to service that debt. So if you're keen to discover more about its earnings, it might be worth checking out this graph of its long term earnings trend.
In the last year TB Group wasn't profitable at an EBIT level, but managed to grow its revenue by 2.3%, to JP¥2.4b. We usually like to see faster growth from unprofitable companies, but each to their own.
So How Risky Is TB Group?
We have no doubt that loss making companies are, in general, riskier than profitable ones. And in the last year TB Group had an earnings before interest and tax (EBIT) loss, truth be told. And over the same period it saw negative free cash outflow of JP¥284m and booked a JP¥233m accounting loss. However, it has net cash of JP¥26.0m, so it has a bit of time before it will need more capital. Summing up, we're a little skeptical of this one, as it seems fairly risky in the absence of free cashflow. When analysing debt levels, the balance sheet is the obvious place to start. However, not all investment risk resides within the balance sheet - far from it. Be aware that TB Group is showing 3 warning signs in our investment analysis , you should know about...
Of course, if you're the type of investor who prefers buying stocks without the burden of debt, then don't hesitate to discover our exclusive list of net cash growth stocks, today.
The New Payments ETF Is Live on NASDAQ:
Money is moving to real-time rails, and a newly listed ETF now gives investors direct exposure. Fast settlement. Institutional custody. Simple access.
Explore how this launch could reshape portfolios
Sponsored ContentValuation is complex, but we're here to simplify it.
Discover if TB Group might be undervalued or overvalued with our detailed analysis, featuring fair value estimates, potential risks, dividends, insider trades, and its financial condition.
Access Free AnalysisHave feedback on this article? Concerned about the content? Get in touch with us directly. Alternatively, email editorial-team (at) simplywallst.com.
This article by Simply Wall St is general in nature. We provide commentary based on historical data and analyst forecasts only using an unbiased methodology and our articles are not intended to be financial advice. It does not constitute a recommendation to buy or sell any stock, and does not take account of your objectives, or your financial situation. We aim to bring you long-term focused analysis driven by fundamental data. Note that our analysis may not factor in the latest price-sensitive company announcements or qualitative material. Simply Wall St has no position in any stocks mentioned.
About TSE:6775
TB Group
Engages in LED lighting and ECO, digital signage, electronic money, and store automation businesses.
Excellent balance sheet and overvalued.
Market Insights

Weekly Picks

Early mover in a fast growing industry. Likely to experience share price volatility as they scale


A case for CA$31.80 (undiluted), aka 8,616% upside from CA$0.37 (an 86 bagger!).


Moderation and Stabilisation: HOLD: Fair Price based on a 4-year Cycle is $12.08
Recently Updated Narratives


Title: Market Sentiment Is Dead Wrong — Here's Why PSEC Deserves a Second Look


An amazing opportunity to potentially get a 100 bagger

Amazon: Why the World’s Biggest Platform Still Runs on Invisible Economics
Popular Narratives


Crazy Undervalued 42 Baggers Silver Play (Active & Running Mine)


MicroVision will explode future revenue by 380.37% with a vision towards success


NVDA: Expanding AI Demand Will Drive Major Data Center Investments Through 2026
Trending Discussion
