- Japan
- /
- Electronic Equipment and Components
- /
- TSE:6629
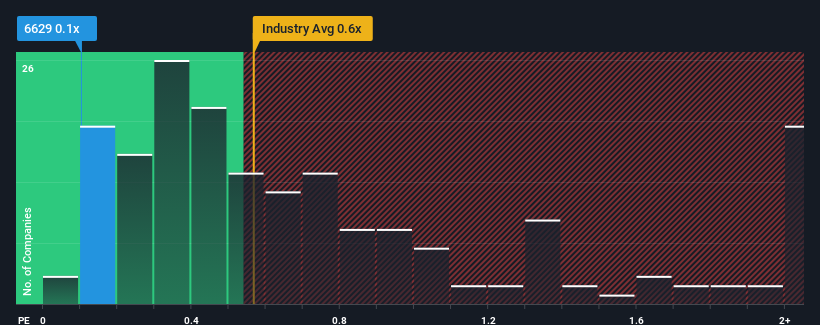
Not Many Are Piling Into Techno Horizon Co.,Ltd. (TSE:6629) Stock Yet As It Plummets 26%

The Techno Horizon Co.,Ltd. (TSE:6629) share price has fared very poorly over the last month, falling by a substantial 26%. Instead of being rewarded, shareholders who have already held through the last twelve months are now sitting on a 28% share price drop.
Even after such a large drop in price, you could still be forgiven for feeling indifferent about Techno HorizonLtd's P/S ratio of 0.1x, since the median price-to-sales (or "P/S") ratio for the Electronic industry in Japan is also close to 0.6x. Although, it's not wise to simply ignore the P/S without explanation as investors may be disregarding a distinct opportunity or a costly mistake.
View our latest analysis for Techno HorizonLtd
What Does Techno HorizonLtd's Recent Performance Look Like?
Revenue has risen at a steady rate over the last year for Techno HorizonLtd, which is generally not a bad outcome. Perhaps the expectation moving forward is that the revenue growth will track in line with the wider industry for the near term, which has kept the P/S subdued. If you like the company, you'd be hoping this isn't the case so that you could potentially pick up some stock while it's not quite in favour.
We don't have analyst forecasts, but you can see how recent trends are setting up the company for the future by checking out our free report on Techno HorizonLtd's earnings, revenue and cash flow.Do Revenue Forecasts Match The P/S Ratio?
Techno HorizonLtd's P/S ratio would be typical for a company that's only expected to deliver moderate growth, and importantly, perform in line with the industry.
Taking a look back first, we see that the company managed to grow revenues by a handy 5.0% last year. The latest three year period has also seen an excellent 76% overall rise in revenue, aided somewhat by its short-term performance. So we can start by confirming that the company has done a great job of growing revenues over that time.
This is in contrast to the rest of the industry, which is expected to grow by 8.1% over the next year, materially lower than the company's recent medium-term annualised growth rates.
With this information, we find it interesting that Techno HorizonLtd is trading at a fairly similar P/S compared to the industry. Apparently some shareholders believe the recent performance is at its limits and have been accepting lower selling prices.
The Key Takeaway
With its share price dropping off a cliff, the P/S for Techno HorizonLtd looks to be in line with the rest of the Electronic industry. It's argued the price-to-sales ratio is an inferior measure of value within certain industries, but it can be a powerful business sentiment indicator.
We didn't quite envision Techno HorizonLtd's P/S sitting in line with the wider industry, considering the revenue growth over the last three-year is higher than the current industry outlook. There could be some unobserved threats to revenue preventing the P/S ratio from matching this positive performance. At least the risk of a price drop looks to be subdued if recent medium-term revenue trends continue, but investors seem to think future revenue could see some volatility.
Having said that, be aware Techno HorizonLtd is showing 4 warning signs in our investment analysis, and 2 of those are potentially serious.
If you're unsure about the strength of Techno HorizonLtd's business, why not explore our interactive list of stocks with solid business fundamentals for some other companies you may have missed.
Mobile Infrastructure for Defense and Disaster
The next wave in robotics isn't humanoid. Its fully autonomous towers delivering 5G, ISR, and radar in under 30 minutes, anywhere.
Get the investor briefing before the next round of contracts
Sponsored On Behalf of CiTechValuation is complex, but we're here to simplify it.
Discover if Techno HorizonLtd might be undervalued or overvalued with our detailed analysis, featuring fair value estimates, potential risks, dividends, insider trades, and its financial condition.
Access Free AnalysisHave feedback on this article? Concerned about the content? Get in touch with us directly. Alternatively, email editorial-team (at) simplywallst.com.
This article by Simply Wall St is general in nature. We provide commentary based on historical data and analyst forecasts only using an unbiased methodology and our articles are not intended to be financial advice. It does not constitute a recommendation to buy or sell any stock, and does not take account of your objectives, or your financial situation. We aim to bring you long-term focused analysis driven by fundamental data. Note that our analysis may not factor in the latest price-sensitive company announcements or qualitative material. Simply Wall St has no position in any stocks mentioned.
About TSE:6629
Techno HorizonLtd
Manufactures and sells products in Video and IT, and robotics categories in Japan, North America, China, Singapore, the Rest of Asia, and internationally.
Medium-low risk with adequate balance sheet.
Market Insights

Weekly Picks

Early mover in a fast growing industry. Likely to experience share price volatility as they scale


A case for CA$31.80 (undiluted), aka 8,616% upside from CA$0.37 (an 86 bagger!).


Moderation and Stabilisation: HOLD: Fair Price based on a 4-year Cycle is $12.08
Recently Updated Narratives

Airbnb Stock: Platform Growth in a World of Saturation and Scrutiny

Clarivate Stock: When Data Becomes the Backbone of Innovation and Law

Adobe Stock: AI-Fueled ARR Growth Pushes Guidance Higher, But Cost Pressures Loom
Popular Narratives


Crazy Undervalued 42 Baggers Silver Play (Active & Running Mine)


NVDA: Expanding AI Demand Will Drive Major Data Center Investments Through 2026


MicroVision will explode future revenue by 380.37% with a vision towards success
Trending Discussion
