- Japan
- /
- Electronic Equipment and Components
- /
- TSE:6629
Does Techno HorizonLtd (TSE:6629) Have A Healthy Balance Sheet?
Warren Buffett famously said, 'Volatility is far from synonymous with risk.' So it might be obvious that you need to consider debt, when you think about how risky any given stock is, because too much debt can sink a company. We can see that Techno Horizon Co.,Ltd. (TSE:6629) does use debt in its business. But should shareholders be worried about its use of debt?
What Risk Does Debt Bring?
Debt assists a business until the business has trouble paying it off, either with new capital or with free cash flow. Part and parcel of capitalism is the process of 'creative destruction' where failed businesses are mercilessly liquidated by their bankers. However, a more usual (but still expensive) situation is where a company must dilute shareholders at a cheap share price simply to get debt under control. Having said that, the most common situation is where a company manages its debt reasonably well - and to its own advantage. The first step when considering a company's debt levels is to consider its cash and debt together.
What Is Techno HorizonLtd's Debt?
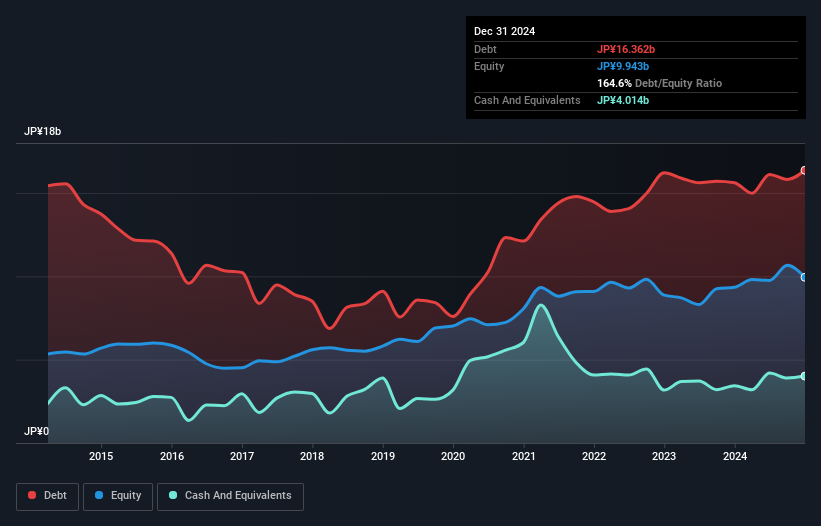
The image below, which you can click on for greater detail, shows that at December 2024 Techno HorizonLtd had debt of JP¥16.4b, up from JP¥15.6b in one year. However, it also had JP¥4.01b in cash, and so its net debt is JP¥12.3b.

A Look At Techno HorizonLtd's Liabilities
According to the last reported balance sheet, Techno HorizonLtd had liabilities of JP¥21.7b due within 12 months, and liabilities of JP¥4.69b due beyond 12 months. Offsetting these obligations, it had cash of JP¥4.01b as well as receivables valued at JP¥10.9b due within 12 months. So it has liabilities totalling JP¥11.5b more than its cash and near-term receivables, combined.
The deficiency here weighs heavily on the JP¥6.00b company itself, as if a child were struggling under the weight of an enormous back-pack full of books, his sports gear, and a trumpet. So we'd watch its balance sheet closely, without a doubt. After all, Techno HorizonLtd would likely require a major re-capitalisation if it had to pay its creditors today.
Check out our latest analysis for Techno HorizonLtd
We use two main ratios to inform us about debt levels relative to earnings. The first is net debt divided by earnings before interest, tax, depreciation, and amortization (EBITDA), while the second is how many times its earnings before interest and tax (EBIT) covers its interest expense (or its interest cover, for short). This way, we consider both the absolute quantum of the debt, as well as the interest rates paid on it.
Techno HorizonLtd's net debt is 4.7 times its EBITDA, which is a significant but still reasonable amount of leverage. However, its interest coverage of 12.8 is very high, suggesting that the interest expense on the debt is currently quite low. Importantly, Techno HorizonLtd grew its EBIT by 78% over the last twelve months, and that growth will make it easier to handle its debt. The balance sheet is clearly the area to focus on when you are analysing debt. But it is Techno HorizonLtd's earnings that will influence how the balance sheet holds up in the future. So when considering debt, it's definitely worth looking at the earnings trend. Click here for an interactive snapshot.
Finally, while the tax-man may adore accounting profits, lenders only accept cold hard cash. So we always check how much of that EBIT is translated into free cash flow. During the last two years, Techno HorizonLtd produced sturdy free cash flow equating to 65% of its EBIT, about what we'd expect. This free cash flow puts the company in a good position to pay down debt, when appropriate.
Our View
While Techno HorizonLtd's level of total liabilities has us nervous. To wit both its interest cover and EBIT growth rate were encouraging signs. Looking at all the angles mentioned above, it does seem to us that Techno HorizonLtd is a somewhat risky investment as a result of its debt. That's not necessarily a bad thing, since leverage can boost returns on equity, but it is something to be aware of. When analysing debt levels, the balance sheet is the obvious place to start. But ultimately, every company can contain risks that exist outside of the balance sheet. Case in point: We've spotted 4 warning signs for Techno HorizonLtd you should be aware of, and 2 of them can't be ignored.
If, after all that, you're more interested in a fast growing company with a rock-solid balance sheet, then check out our list of net cash growth stocks without delay.
Valuation is complex, but we're here to simplify it.
Discover if Techno HorizonLtd might be undervalued or overvalued with our detailed analysis, featuring fair value estimates, potential risks, dividends, insider trades, and its financial condition.
Access Free AnalysisHave feedback on this article? Concerned about the content? Get in touch with us directly. Alternatively, email editorial-team (at) simplywallst.com.
This article by Simply Wall St is general in nature. We provide commentary based on historical data and analyst forecasts only using an unbiased methodology and our articles are not intended to be financial advice. It does not constitute a recommendation to buy or sell any stock, and does not take account of your objectives, or your financial situation. We aim to bring you long-term focused analysis driven by fundamental data. Note that our analysis may not factor in the latest price-sensitive company announcements or qualitative material. Simply Wall St has no position in any stocks mentioned.
About TSE:6629
Techno HorizonLtd
Engages in the imaging and IT, and robotics businesses in Japan.
Medium-low risk with adequate balance sheet.
Market Insights
Community Narratives


