
Advertisement
- Japan
- /
- Tech Hardware
- /
- TSE:6448
Is There An Opportunity With Brother Industries, Ltd.'s (TSE:6448) 27% Undervaluation?

Key Insights
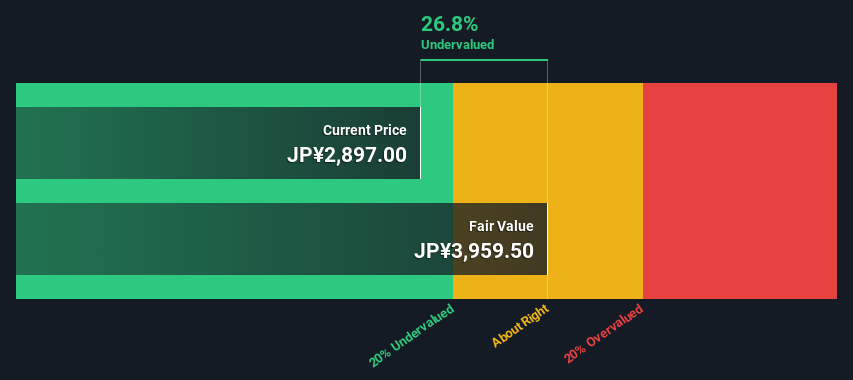
- Brother Industries' estimated fair value is JP¥3,959 based on 2 Stage Free Cash Flow to Equity
- Brother Industries' JP¥2,897 share price signals that it might be 27% undervalued
- Our fair value estimate is 41% higher than Brother Industries' analyst price target of JP¥2,813
How far off is Brother Industries, Ltd. (TSE:6448) from its intrinsic value? Using the most recent financial data, we'll take a look at whether the stock is fairly priced by taking the expected future cash flows and discounting them to today's value. The Discounted Cash Flow (DCF) model is the tool we will apply to do this. It may sound complicated, but actually it is quite simple!
Remember though, that there are many ways to estimate a company's value, and a DCF is just one method. If you want to learn more about discounted cash flow, the rationale behind this calculation can be read in detail in the Simply Wall St analysis model.
View our latest analysis for Brother Industries
Step By Step Through The Calculation
We're using the 2-stage growth model, which simply means we take in account two stages of company's growth. In the initial period the company may have a higher growth rate and the second stage is usually assumed to have a stable growth rate. To start off with, we need to estimate the next ten years of cash flows. Where possible we use analyst estimates, but when these aren't available we extrapolate the previous free cash flow (FCF) from the last estimate or reported value. We assume companies with shrinking free cash flow will slow their rate of shrinkage, and that companies with growing free cash flow will see their growth rate slow, over this period. We do this to reflect that growth tends to slow more in the early years than it does in later years.
A DCF is all about the idea that a dollar in the future is less valuable than a dollar today, and so the sum of these future cash flows is then discounted to today's value:
10-year free cash flow (FCF) forecast
| 2024 | 2025 | 2026 | 2027 | 2028 | 2029 | 2030 | 2031 | 2032 | 2033 | |
| Levered FCF (¥, Millions) | JP¥67.7b | JP¥53.2b | JP¥47.9b | JP¥56.8b | JP¥61.2b | JP¥64.3b | JP¥66.4b | JP¥67.9b | JP¥69.1b | JP¥69.9b |
| Growth Rate Estimate Source | Analyst x1 | Analyst x1 | Analyst x2 | Analyst x1 | Analyst x1 | Analyst x1 | Est @ 3.24% | Est @ 2.33% | Est @ 1.69% | Est @ 1.24% |
| Present Value (¥, Millions) Discounted @ 6.6% | JP¥63.5k | JP¥46.8k | JP¥39.5k | JP¥43.9k | JP¥44.4k | JP¥43.7k | JP¥42.3k | JP¥40.6k | JP¥38.7k | JP¥36.8k |
("Est" = FCF growth rate estimated by Simply Wall St)
Present Value of 10-year Cash Flow (PVCF) = JP¥440b
The second stage is also known as Terminal Value, this is the business's cash flow after the first stage. For a number of reasons a very conservative growth rate is used that cannot exceed that of a country's GDP growth. In this case we have used the 5-year average of the 10-year government bond yield (0.2%) to estimate future growth. In the same way as with the 10-year 'growth' period, we discount future cash flows to today's value, using a cost of equity of 6.6%.
Terminal Value (TV)= FCF2033 × (1 + g) ÷ (r – g) = JP¥70b× (1 + 0.2%) ÷ (6.6%– 0.2%) = JP¥1.1t
Present Value of Terminal Value (PVTV)= TV / (1 + r)10= JP¥1.1t÷ ( 1 + 6.6%)10= JP¥572b
The total value is the sum of cash flows for the next ten years plus the discounted terminal value, which results in the Total Equity Value, which in this case is JP¥1.0t. The last step is to then divide the equity value by the number of shares outstanding. Relative to the current share price of JP¥2.9k, the company appears a touch undervalued at a 27% discount to where the stock price trades currently. Remember though, that this is just an approximate valuation, and like any complex formula - garbage in, garbage out.
Important Assumptions
The calculation above is very dependent on two assumptions. The first is the discount rate and the other is the cash flows. If you don't agree with these result, have a go at the calculation yourself and play with the assumptions. The DCF also does not consider the possible cyclicality of an industry, or a company's future capital requirements, so it does not give a full picture of a company's potential performance. Given that we are looking at Brother Industries as potential shareholders, the cost of equity is used as the discount rate, rather than the cost of capital (or weighted average cost of capital, WACC) which accounts for debt. In this calculation we've used 6.6%, which is based on a levered beta of 1.144. Beta is a measure of a stock's volatility, compared to the market as a whole. We get our beta from the industry average beta of globally comparable companies, with an imposed limit between 0.8 and 2.0, which is a reasonable range for a stable business.
SWOT Analysis for Brother Industries
Strength
- Debt is not viewed as a risk.
- Dividends are covered by earnings and cash flows.
Weakness
- Earnings declined over the past year.
- Dividend is low compared to the top 25% of dividend payers in the Tech market.
Opportunity
- Annual earnings are forecast to grow faster than the Japanese market.
- Trading below our estimate of fair value by more than 20%.
Threat
- Annual revenue is forecast to grow slower than the Japanese market.
Looking Ahead:
Valuation is only one side of the coin in terms of building your investment thesis, and it shouldn't be the only metric you look at when researching a company. The DCF model is not a perfect stock valuation tool. Instead the best use for a DCF model is to test certain assumptions and theories to see if they would lead to the company being undervalued or overvalued. If a company grows at a different rate, or if its cost of equity or risk free rate changes sharply, the output can look very different. Can we work out why the company is trading at a discount to intrinsic value? For Brother Industries, we've compiled three fundamental aspects you should explore:
- Risks: Consider for instance, the ever-present spectre of investment risk. We've identified 1 warning sign with Brother Industries , and understanding this should be part of your investment process.
- Future Earnings: How does 6448's growth rate compare to its peers and the wider market? Dig deeper into the analyst consensus number for the upcoming years by interacting with our free analyst growth expectation chart.
- Other High Quality Alternatives: Do you like a good all-rounder? Explore our interactive list of high quality stocks to get an idea of what else is out there you may be missing!
PS. The Simply Wall St app conducts a discounted cash flow valuation for every stock on the TSE every day. If you want to find the calculation for other stocks just search here.
Valuation is complex, but we're here to simplify it.
Discover if Brother Industries might be undervalued or overvalued with our detailed analysis, featuring fair value estimates, potential risks, dividends, insider trades, and its financial condition.
Access Free AnalysisHave feedback on this article? Concerned about the content? Get in touch with us directly. Alternatively, email editorial-team (at) simplywallst.com.
This article by Simply Wall St is general in nature. We provide commentary based on historical data and analyst forecasts only using an unbiased methodology and our articles are not intended to be financial advice. It does not constitute a recommendation to buy or sell any stock, and does not take account of your objectives, or your financial situation. We aim to bring you long-term focused analysis driven by fundamental data. Note that our analysis may not factor in the latest price-sensitive company announcements or qualitative material. Simply Wall St has no position in any stocks mentioned.
Have feedback on this article? Concerned about the content? Get in touch with us directly. Alternatively, email editorial-team@simplywallst.com
About TSE:6448
Brother Industries
Manufactures and sells communications and printing equipment in Japan, the Americas, Europe, Asia, Oceania, the Middle East, Africa, and internationally.
Very undervalued with flawless balance sheet and pays a dividend.
Similar Companies
Market Insights

Advertisement
Community Narratives
Vita Life Sciences Set for a 12.72% Revenue Growth While Tackling Operational Challenges
Fair Value AU$2.42|8.7% undervalued
RO
Community Contributor
Vossloh rides a €500 billion wave to boost growth and earnings in the next decade
Fair Value €78.41|6.3% undervalued
CH
Community Contributor
Intuitive Surgical Will Transform Healthcare with 12% Revenue Growth
Fair Value US$325.55|56.5% overvalued
UN
Community Contributor