- Japan
- /
- Tech Hardware
- /
- TSE:6413
Riso Kagaku's (TSE:6413) five-year earnings growth trails the 18% YoY shareholder returns

Stock pickers are generally looking for stocks that will outperform the broader market. Buying under-rated businesses is one path to excess returns. For example, long term Riso Kagaku Corporation (TSE:6413) shareholders have enjoyed a 96% share price rise over the last half decade, well in excess of the market return of around 69% (not including dividends). On the other hand, the more recent gains haven't been so impressive, with shareholders gaining just 56%, including dividends.
The past week has proven to be lucrative for Riso Kagaku investors, so let's see if fundamentals drove the company's five-year performance.
View our latest analysis for Riso Kagaku
In his essay The Superinvestors of Graham-and-Doddsville Warren Buffett described how share prices do not always rationally reflect the value of a business. One imperfect but simple way to consider how the market perception of a company has shifted is to compare the change in the earnings per share (EPS) with the share price movement.
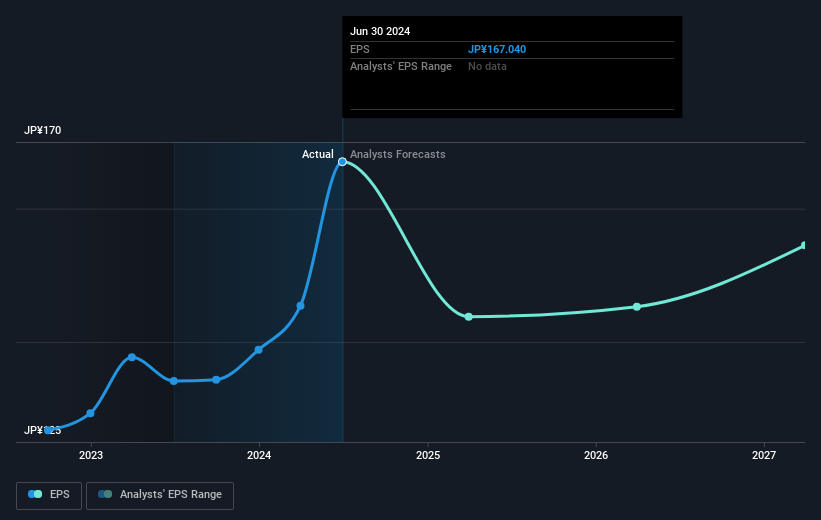
Over half a decade, Riso Kagaku managed to grow its earnings per share at 21% a year. The EPS growth is more impressive than the yearly share price gain of 14% over the same period. So one could conclude that the broader market has become more cautious towards the stock.
You can see how EPS has changed over time in the image below (click on the chart to see the exact values).
We know that Riso Kagaku has improved its bottom line over the last three years, but what does the future have in store? If you are thinking of buying or selling Riso Kagaku stock, you should check out this FREE detailed report on its balance sheet.
What About Dividends?
When looking at investment returns, it is important to consider the difference between total shareholder return (TSR) and share price return. Whereas the share price return only reflects the change in the share price, the TSR includes the value of dividends (assuming they were reinvested) and the benefit of any discounted capital raising or spin-off. It's fair to say that the TSR gives a more complete picture for stocks that pay a dividend. As it happens, Riso Kagaku's TSR for the last 5 years was 132%, which exceeds the share price return mentioned earlier. And there's no prize for guessing that the dividend payments largely explain the divergence!
A Different Perspective
We're pleased to report that Riso Kagaku shareholders have received a total shareholder return of 56% over one year. And that does include the dividend. Since the one-year TSR is better than the five-year TSR (the latter coming in at 18% per year), it would seem that the stock's performance has improved in recent times. Given the share price momentum remains strong, it might be worth taking a closer look at the stock, lest you miss an opportunity. It's always interesting to track share price performance over the longer term. But to understand Riso Kagaku better, we need to consider many other factors. For instance, we've identified 2 warning signs for Riso Kagaku (1 is significant) that you should be aware of.
If you like to buy stocks alongside management, then you might just love this free list of companies. (Hint: many of them are unnoticed AND have attractive valuation).
Please note, the market returns quoted in this article reflect the market weighted average returns of stocks that currently trade on Japanese exchanges.
New: AI Stock Screener & Alerts
Our new AI Stock Screener scans the market every day to uncover opportunities.
• Dividend Powerhouses (3%+ Yield)
• Undervalued Small Caps with Insider Buying
• High growth Tech and AI Companies
Or build your own from over 50 metrics.
Have feedback on this article? Concerned about the content? Get in touch with us directly. Alternatively, email editorial-team (at) simplywallst.com.
This article by Simply Wall St is general in nature. We provide commentary based on historical data and analyst forecasts only using an unbiased methodology and our articles are not intended to be financial advice. It does not constitute a recommendation to buy or sell any stock, and does not take account of your objectives, or your financial situation. We aim to bring you long-term focused analysis driven by fundamental data. Note that our analysis may not factor in the latest price-sensitive company announcements or qualitative material. Simply Wall St has no position in any stocks mentioned.
About TSE:6413
Riso Kagaku
Operates in the printing equipment, real estate, and other businesses in Japan and internationally.
Excellent balance sheet with proven track record and pays a dividend.
