
Advertisement
- Japan
- /
- Electronic Equipment and Components
- /
- TSE:3107
Daiwabo Holdings Co., Ltd.'s (TSE:3107) Popularity With Investors Under Threat As Stock Sinks 26%
Daiwabo Holdings Co., Ltd. (TSE:3107) shares have had a horrible month, losing 26% after a relatively good period beforehand. The drop over the last 30 days has capped off a tough year for shareholders, with the share price down 16% in that time.
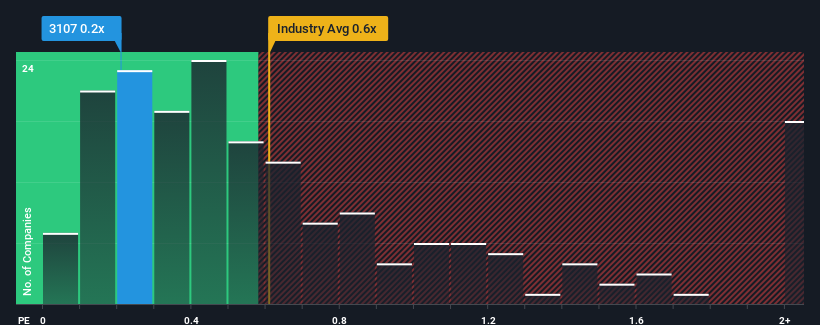
Even after such a large drop in price, there still wouldn't be many who think Daiwabo Holdings' price-to-sales (or "P/S") ratio of 0.2x is worth a mention when the median P/S in Japan's Electronic industry is similar at about 0.6x. While this might not raise any eyebrows, if the P/S ratio is not justified investors could be missing out on a potential opportunity or ignoring looming disappointment.
View our latest analysis for Daiwabo Holdings
How Daiwabo Holdings Has Been Performing
Recent times have been advantageous for Daiwabo Holdings as its revenues have been rising faster than most other companies. Perhaps the market is expecting this level of performance to taper off, keeping the P/S from soaring. If the company manages to stay the course, then investors should be rewarded with a share price that matches its revenue figures.
Want the full picture on analyst estimates for the company? Then our free report on Daiwabo Holdings will help you uncover what's on the horizon.Is There Some Revenue Growth Forecasted For Daiwabo Holdings?
In order to justify its P/S ratio, Daiwabo Holdings would need to produce growth that's similar to the industry.
If we review the last year of revenue growth, the company posted a worthy increase of 7.1%. Ultimately though, it couldn't turn around the poor performance of the prior period, with revenue shrinking 7.3% in total over the last three years. Therefore, it's fair to say the revenue growth recently has been undesirable for the company.
Shifting to the future, estimates from the two analysts covering the company suggest revenue should grow by 2.8% per annum over the next three years. Meanwhile, the rest of the industry is forecast to expand by 7.9% per annum, which is noticeably more attractive.
In light of this, it's curious that Daiwabo Holdings' P/S sits in line with the majority of other companies. Apparently many investors in the company are less bearish than analysts indicate and aren't willing to let go of their stock right now. These shareholders may be setting themselves up for future disappointment if the P/S falls to levels more in line with the growth outlook.
The Bottom Line On Daiwabo Holdings' P/S
Following Daiwabo Holdings' share price tumble, its P/S is just clinging on to the industry median P/S. Typically, we'd caution against reading too much into price-to-sales ratios when settling on investment decisions, though it can reveal plenty about what other market participants think about the company.
Given that Daiwabo Holdings' revenue growth projections are relatively subdued in comparison to the wider industry, it comes as a surprise to see it trading at its current P/S ratio. At present, we aren't confident in the P/S as the predicted future revenues aren't likely to support a more positive sentiment for long. This places shareholders' investments at risk and potential investors in danger of paying an unnecessary premium.
There are also other vital risk factors to consider before investing and we've discovered 3 warning signs for Daiwabo Holdings that you should be aware of.
It's important to make sure you look for a great company, not just the first idea you come across. So if growing profitability aligns with your idea of a great company, take a peek at this free list of interesting companies with strong recent earnings growth (and a low P/E).
New: Manage All Your Stock Portfolios in One Place
We've created the ultimate portfolio companion for stock investors, and it's free.
• Connect an unlimited number of Portfolios and see your total in one currency
• Be alerted to new Warning Signs or Risks via email or mobile
• Track the Fair Value of your stocks
Have feedback on this article? Concerned about the content? Get in touch with us directly. Alternatively, email editorial-team (at) simplywallst.com.
This article by Simply Wall St is general in nature. We provide commentary based on historical data and analyst forecasts only using an unbiased methodology and our articles are not intended to be financial advice. It does not constitute a recommendation to buy or sell any stock, and does not take account of your objectives, or your financial situation. We aim to bring you long-term focused analysis driven by fundamental data. Note that our analysis may not factor in the latest price-sensitive company announcements or qualitative material. Simply Wall St has no position in any stocks mentioned.
Have feedback on this article? Concerned about the content? Get in touch with us directly. Alternatively, email editorial-team@simplywallst.com
About TSE:3107
Flawless balance sheet average dividend payer.
Market Insights

Advertisement
Community Narratives
MicroVision will explode future revenue by 380.37% with a vision towards success
Fair Value US$60|98.4% undervalued
TH
Community Contributor
The Indispensable Artery for a New North American Economy
Fair Value CA$132.87|0.7% overvalued
TI
Community Contributor
Recently Updated Narratives
NI

niteco on Texas Instruments ·
Engineered for Stability. Positioned for Growth.
Fair Value:US$314.4446.5% undervalued
1 followerusers have followed this narrative
0 commentsusers have commented on this narrative
0 likesusers have liked this narrative
BE


Bejgal on MINISO Group Holding ·
MINISO's fair value is projected at 26.69 with an anticipated PE ratio shift of 20x
Fair Value:US$28.1829.5% undervalued
46 followersusers have followed this narrative
3 commentsusers have commented on this narrative
0 likesusers have liked this narrative
BE

Bejgal on Fiverr International ·
Fiverr International will transform the freelance industry with AI-powered growth
Fair Value:US$36.8143.1% undervalued
79 followersusers have followed this narrative
7 commentsusers have commented on this narrative
0 likesusers have liked this narrative
Popular Narratives
TH

TheWallstreetKing on MicroVision ·
MicroVision will explode future revenue by 380.37% with a vision towards success
Fair Value:US$6098.4% undervalued
109 followersusers have followed this narrative
10 commentsusers have commented on this narrative
21 likesusers have liked this narrative
AN


AnalystConsensusTarget on NVIDIA ·
NVDA: Expanding AI Demand Will Drive Major Data Center Investments Through 2026
Fair Value:US$250.3929.3% undervalued
939 followersusers have followed this narrative
6 commentsusers have commented on this narrative
24 likesusers have liked this narrative
OS


oscargarcia on Alphabet ·
The company that turned a verb into a global necessity and basically runs the modern internet, digital ads, smartphones, maps, and AI.
Fair Value:US$3405.8% undervalued
145 followersusers have followed this narrative
6 commentsusers have commented on this narrative
18 likesusers have liked this narrative