
Advertisement
Ryomo Systems Co.,Ltd. (TSE:9691) Stock's 33% Dive Might Signal An Opportunity But It Requires Some Scrutiny
To the annoyance of some shareholders, Ryomo Systems Co.,Ltd. (TSE:9691) shares are down a considerable 33% in the last month, which continues a horrid run for the company. Instead of being rewarded, shareholders who have already held through the last twelve months are now sitting on a 31% share price drop.
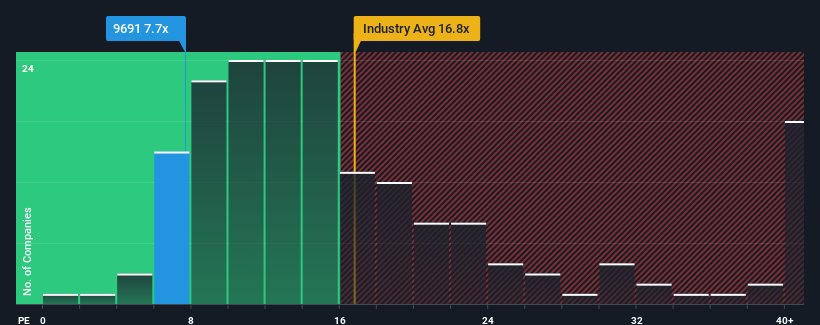
After such a large drop in price, Ryomo SystemsLtd's price-to-earnings (or "P/E") ratio of 7.7x might make it look like a buy right now compared to the market in Japan, where around half of the companies have P/E ratios above 14x and even P/E's above 21x are quite common. Nonetheless, we'd need to dig a little deeper to determine if there is a rational basis for the reduced P/E.
For instance, Ryomo SystemsLtd's receding earnings in recent times would have to be some food for thought. It might be that many expect the disappointing earnings performance to continue or accelerate, which has repressed the P/E. However, if this doesn't eventuate then existing shareholders may be feeling optimistic about the future direction of the share price.
Check out our latest analysis for Ryomo SystemsLtd
How Is Ryomo SystemsLtd's Growth Trending?
Ryomo SystemsLtd's P/E ratio would be typical for a company that's only expected to deliver limited growth, and importantly, perform worse than the market.
If we review the last year of earnings, dishearteningly the company's profits fell to the tune of 45%. That put a dampener on the good run it was having over the longer-term as its three-year EPS growth is still a noteworthy 26% in total. So we can start by confirming that the company has generally done a good job of growing earnings over that time, even though it had some hiccups along the way.
Comparing that to the market, which is predicted to deliver 9.8% growth in the next 12 months, the company's momentum is pretty similar based on recent medium-term annualised earnings results.
In light of this, it's peculiar that Ryomo SystemsLtd's P/E sits below the majority of other companies. It may be that most investors are not convinced the company can maintain recent growth rates.
The Final Word
Ryomo SystemsLtd's recently weak share price has pulled its P/E below most other companies. While the price-to-earnings ratio shouldn't be the defining factor in whether you buy a stock or not, it's quite a capable barometer of earnings expectations.
Our examination of Ryomo SystemsLtd revealed its three-year earnings trends aren't contributing to its P/E as much as we would have predicted, given they look similar to current market expectations. There could be some unobserved threats to earnings preventing the P/E ratio from matching the company's performance. It appears some are indeed anticipating earnings instability, because the persistence of these recent medium-term conditions should normally provide more support to the share price.
Before you settle on your opinion, we've discovered 5 warning signs for Ryomo SystemsLtd (1 can't be ignored!) that you should be aware of.
If you're unsure about the strength of Ryomo SystemsLtd's business, why not explore our interactive list of stocks with solid business fundamentals for some other companies you may have missed.
New: AI Stock Screener & Alerts
Our new AI Stock Screener scans the market every day to uncover opportunities.
• Dividend Powerhouses (3%+ Yield)
• Undervalued Small Caps with Insider Buying
• High growth Tech and AI Companies
Or build your own from over 50 metrics.
Have feedback on this article? Concerned about the content? Get in touch with us directly. Alternatively, email editorial-team (at) simplywallst.com.
This article by Simply Wall St is general in nature. We provide commentary based on historical data and analyst forecasts only using an unbiased methodology and our articles are not intended to be financial advice. It does not constitute a recommendation to buy or sell any stock, and does not take account of your objectives, or your financial situation. We aim to bring you long-term focused analysis driven by fundamental data. Note that our analysis may not factor in the latest price-sensitive company announcements or qualitative material. Simply Wall St has no position in any stocks mentioned.
Have feedback on this article? Concerned about the content? Get in touch with us directly. Alternatively, email editorial-team@simplywallst.com
About TSE:9691
Ryomo SystemsLtd
Provides software development and system sales, information processing, product-related sales, and other information services in Japan.
Flawless balance sheet with solid track record.
Market Insights

Advertisement
Community Narratives
MicroVision will explode future revenue by 380.37% with a vision towards success
Fair Value US$60.00|98.4% undervalued
TH
Community Contributor
The Indispensable Artery for a New North American Economy
Fair Value CA$132.87|1.3% undervalued
TI
Community Contributor