
Advertisement
Key Insights
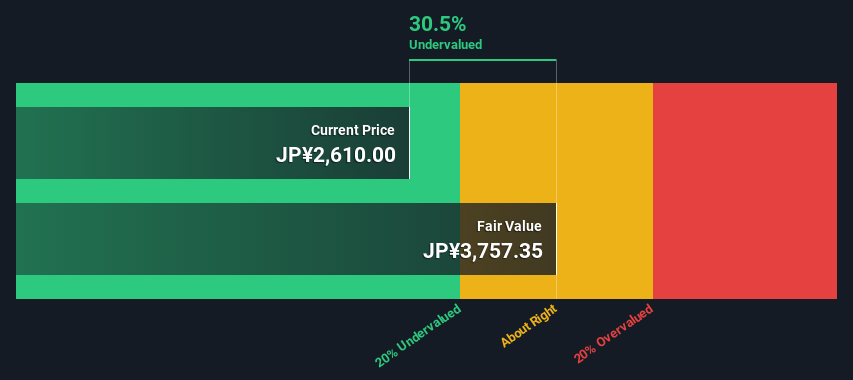
- The projected fair value for NCD is JP¥3,757 based on 2 Stage Free Cash Flow to Equity
- Current share price of JP¥2,610 suggests NCD is potentially 31% undervalued
- Peers of NCD are currently trading on average at a 98% premium
How far off is NCD Co., Ltd. (TSE:4783) from its intrinsic value? Using the most recent financial data, we'll take a look at whether the stock is fairly priced by projecting its future cash flows and then discounting them to today's value. We will take advantage of the Discounted Cash Flow (DCF) model for this purpose. It may sound complicated, but actually it is quite simple!
We would caution that there are many ways of valuing a company and, like the DCF, each technique has advantages and disadvantages in certain scenarios. For those who are keen learners of equity analysis, the Simply Wall St analysis model here may be something of interest to you.
The Model
We're using the 2-stage growth model, which simply means we take in account two stages of company's growth. In the initial period the company may have a higher growth rate and the second stage is usually assumed to have a stable growth rate. To start off with, we need to estimate the next ten years of cash flows. Seeing as no analyst estimates of free cash flow are available to us, we have extrapolate the previous free cash flow (FCF) from the company's last reported value. We assume companies with shrinking free cash flow will slow their rate of shrinkage, and that companies with growing free cash flow will see their growth rate slow, over this period. We do this to reflect that growth tends to slow more in the early years than it does in later years.
A DCF is all about the idea that a dollar in the future is less valuable than a dollar today, so we discount the value of these future cash flows to their estimated value in today's dollars:
10-year free cash flow (FCF) forecast
| 2025 | 2026 | 2027 | 2028 | 2029 | 2030 | 2031 | 2032 | 2033 | 2034 | |
| Levered FCF (¥, Millions) | JP¥1.77b | JP¥1.83b | JP¥1.87b | JP¥1.90b | JP¥1.92b | JP¥1.94b | JP¥1.96b | JP¥1.97b | JP¥1.99b | JP¥2.00b |
| Growth Rate Estimate Source | Est @ 4.31% | Est @ 3.13% | Est @ 2.30% | Est @ 1.72% | Est @ 1.32% | Est @ 1.03% | Est @ 0.83% | Est @ 0.69% | Est @ 0.60% | Est @ 0.53% |
| Present Value (¥, Millions) Discounted @ 6.6% | JP¥1.7k | JP¥1.6k | JP¥1.5k | JP¥1.5k | JP¥1.4k | JP¥1.3k | JP¥1.3k | JP¥1.2k | JP¥1.1k | JP¥1.1k |
("Est" = FCF growth rate estimated by Simply Wall St)
Present Value of 10-year Cash Flow (PVCF) = JP¥14b
After calculating the present value of future cash flows in the initial 10-year period, we need to calculate the Terminal Value, which accounts for all future cash flows beyond the first stage. For a number of reasons a very conservative growth rate is used that cannot exceed that of a country's GDP growth. In this case we have used the 5-year average of the 10-year government bond yield (0.4%) to estimate future growth. In the same way as with the 10-year 'growth' period, we discount future cash flows to today's value, using a cost of equity of 6.6%.
Terminal Value (TV)= FCF2034 × (1 + g) ÷ (r – g) = JP¥2.0b× (1 + 0.4%) ÷ (6.6%– 0.4%) = JP¥32b
Present Value of Terminal Value (PVTV)= TV / (1 + r)10= JP¥32b÷ ( 1 + 6.6%)10= JP¥17b
The total value, or equity value, is then the sum of the present value of the future cash flows, which in this case is JP¥31b. The last step is to then divide the equity value by the number of shares outstanding. Relative to the current share price of JP¥2.6k, the company appears quite good value at a 31% discount to where the stock price trades currently. Remember though, that this is just an approximate valuation, and like any complex formula - garbage in, garbage out.
Important Assumptions
We would point out that the most important inputs to a discounted cash flow are the discount rate and of course the actual cash flows. Part of investing is coming up with your own evaluation of a company's future performance, so try the calculation yourself and check your own assumptions. The DCF also does not consider the possible cyclicality of an industry, or a company's future capital requirements, so it does not give a full picture of a company's potential performance. Given that we are looking at NCD as potential shareholders, the cost of equity is used as the discount rate, rather than the cost of capital (or weighted average cost of capital, WACC) which accounts for debt. In this calculation we've used 6.6%, which is based on a levered beta of 1.177. Beta is a measure of a stock's volatility, compared to the market as a whole. We get our beta from the industry average beta of globally comparable companies, with an imposed limit between 0.8 and 2.0, which is a reasonable range for a stable business.
See our latest analysis for NCD
SWOT Analysis for NCD
Strength
- Earnings growth over the past year exceeded the industry.
- Debt is not viewed as a risk.
- Dividends are covered by earnings and cash flows.
Weakness
- Dividend is low compared to the top 25% of dividend payers in the IT market.
Opportunity
- Annual revenue is forecast to grow faster than the Japanese market.
- Good value based on P/E ratio and estimated fair value.
Threat
- No apparent threats visible for 4783.
Next Steps:
Whilst important, the DCF calculation ideally won't be the sole piece of analysis you scrutinize for a company. It's not possible to obtain a foolproof valuation with a DCF model. Instead the best use for a DCF model is to test certain assumptions and theories to see if they would lead to the company being undervalued or overvalued. For instance, if the terminal value growth rate is adjusted slightly, it can dramatically alter the overall result. Can we work out why the company is trading at a discount to intrinsic value? For NCD, there are three additional items you should further examine:
- Risks: Be aware that NCD is showing 1 warning sign in our investment analysis , you should know about...
- Future Earnings: How does 4783's growth rate compare to its peers and the wider market? Dig deeper into the analyst consensus number for the upcoming years by interacting with our free analyst growth expectation chart.
- Other Solid Businesses: Low debt, high returns on equity and good past performance are fundamental to a strong business. Why not explore our interactive list of stocks with solid business fundamentals to see if there are other companies you may not have considered!
PS. The Simply Wall St app conducts a discounted cash flow valuation for every stock on the TSE every day. If you want to find the calculation for other stocks just search here.
Valuation is complex, but we're here to simplify it.
Discover if NCD might be undervalued or overvalued with our detailed analysis, featuring fair value estimates, potential risks, dividends, insider trades, and its financial condition.
Access Free AnalysisHave feedback on this article? Concerned about the content? Get in touch with us directly. Alternatively, email editorial-team (at) simplywallst.com.
This article by Simply Wall St is general in nature. We provide commentary based on historical data and analyst forecasts only using an unbiased methodology and our articles are not intended to be financial advice. It does not constitute a recommendation to buy or sell any stock, and does not take account of your objectives, or your financial situation. We aim to bring you long-term focused analysis driven by fundamental data. Note that our analysis may not factor in the latest price-sensitive company announcements or qualitative material. Simply Wall St has no position in any stocks mentioned.
About TSE:4783
NCD
Engages in the system development, support and service, and parking system businesses in Japan.
Flawless balance sheet 6 star dividend payer.
Market Insights

Advertisement
Community Narratives
MicroVision will explode future revenue by 380.37% with a vision towards success
Fair Value US$60|98.4% undervalued
TH
Community Contributor
The Indispensable Artery for a New North American Economy
Fair Value CA$132.87|0.7% overvalued
TI
Community Contributor
Recently Updated Narratives
CE

cementafriend on Constellation Energy ·
Constellation Energy Dividends and Growth
Fair Value:US$348.054.7% overvalued
2 followersusers have followed this narrative
0 commentsusers have commented on this narrative
0 likesusers have liked this narrative
KH

Khagani on CoreWeave ·
CoreWeave's Revenue Expected to Rocket 77.88% in 5-Year Forecast
Fair Value:US$11033.5% undervalued
4 followersusers have followed this narrative
0 commentsusers have commented on this narrative
0 likesusers have liked this narrative
PO

PortfolioPlus on Bisalloy Steel Group ·
Bisalloy Steel Group will shine with a projected profit margin increase of 12.8%
Fair Value:AU$6.7118.0% undervalued
3 followersusers have followed this narrative
0 commentsusers have commented on this narrative
0 likesusers have liked this narrative
Popular Narratives
TH

TheWallstreetKing on MicroVision ·
MicroVision will explode future revenue by 380.37% with a vision towards success
Fair Value:US$6098.4% undervalued
108 followersusers have followed this narrative
10 commentsusers have commented on this narrative
21 likesusers have liked this narrative
AN


AnalystConsensusTarget on NVIDIA ·
NVDA: Expanding AI Demand Will Drive Major Data Center Investments Through 2026
Fair Value:US$250.3929.3% undervalued
936 followersusers have followed this narrative
6 commentsusers have commented on this narrative
24 likesusers have liked this narrative
OS


oscargarcia on Alphabet ·
The company that turned a verb into a global necessity and basically runs the modern internet, digital ads, smartphones, maps, and AI.
Fair Value:US$3405.8% undervalued
144 followersusers have followed this narrative
6 commentsusers have commented on this narrative
18 likesusers have liked this narrative