Advertisement
Is Nomura Research Institute Fairly Priced After Digital Transformation Projects Boost Shares 28%?

Simply Wall St
Reviewed by Bailey Pemberton
- Thinking about whether Nomura Research Institute is a good value right now? You are not alone in asking if the current price reflects the company's true potential.
- This stock may have slipped by 0.4% in the past week and 1.1% over the past month, but it is still up an impressive 23.8% year-to-date and a hefty 28.2% over the past 12 months.
- Recent headlines have spotlighted Nomura Research Institute’s ongoing digital transformation projects for major clients in Japan, which reinforces its leading position in the IT solutions space. These developments appear to have supported steady interest in the stock even as broader tech sentiment has wavered.
- When it comes to valuation, Nomura Research Institute scores 0 out of 6 on our valuation checks. This means it is not considered undervalued in any category. Next, we will explore several common ways investors assess if the stock’s current price matches its true worth. Stay tuned until the end for a fresh perspective that might change how you think about value entirely.
Nomura Research Institute scores just 0/6 on our valuation checks. See what other red flags we found in the full valuation breakdown.
Approach 1: Nomura Research Institute Discounted Cash Flow (DCF) Analysis
A Discounted Cash Flow (DCF) model estimates a company's intrinsic value by projecting its future cash flows and discounting them to today's value. The goal is to assess what the business is worth now based on all the money it could generate in the future.
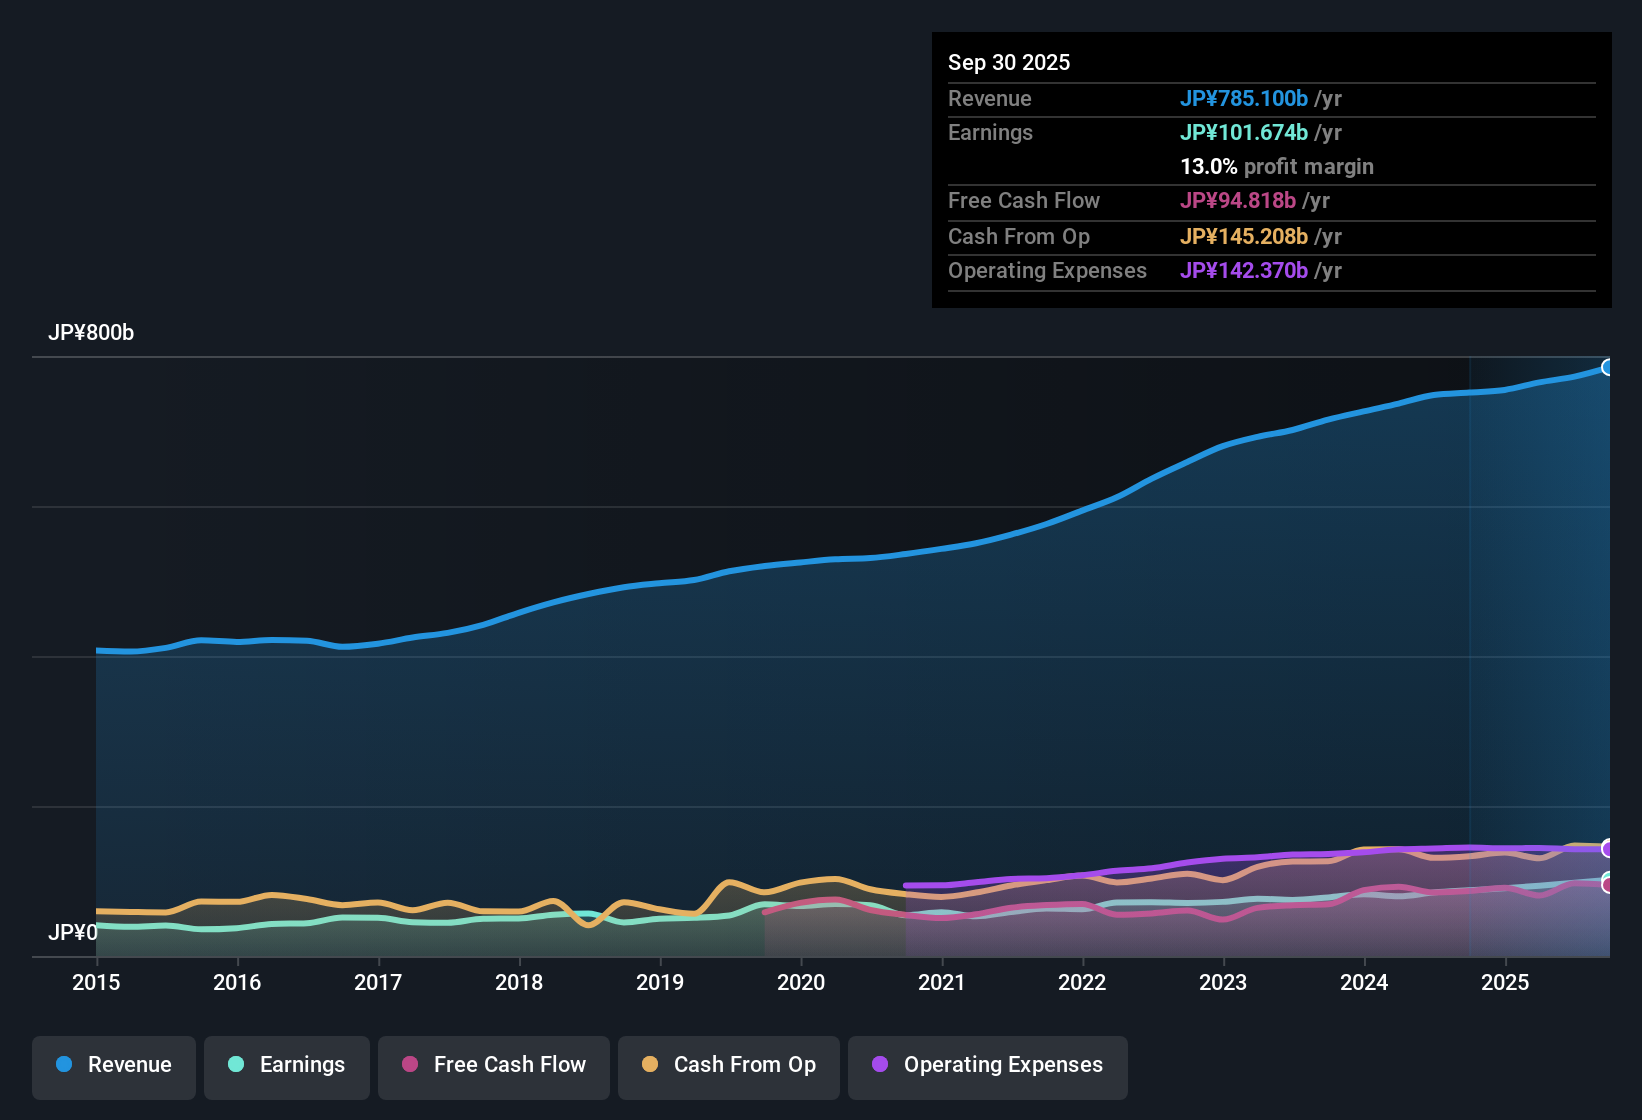
For Nomura Research Institute, the current Free Cash Flow (FCF) stands at approximately ¥91.5 billion. Analyst consensus projects FCF to reach ¥136.1 billion by 2030, with estimates available from analysts for the next five years and further years extrapolated beyond that. This points to steady FCF growth over the coming decade based on both analyst estimates and Simply Wall St's projections.
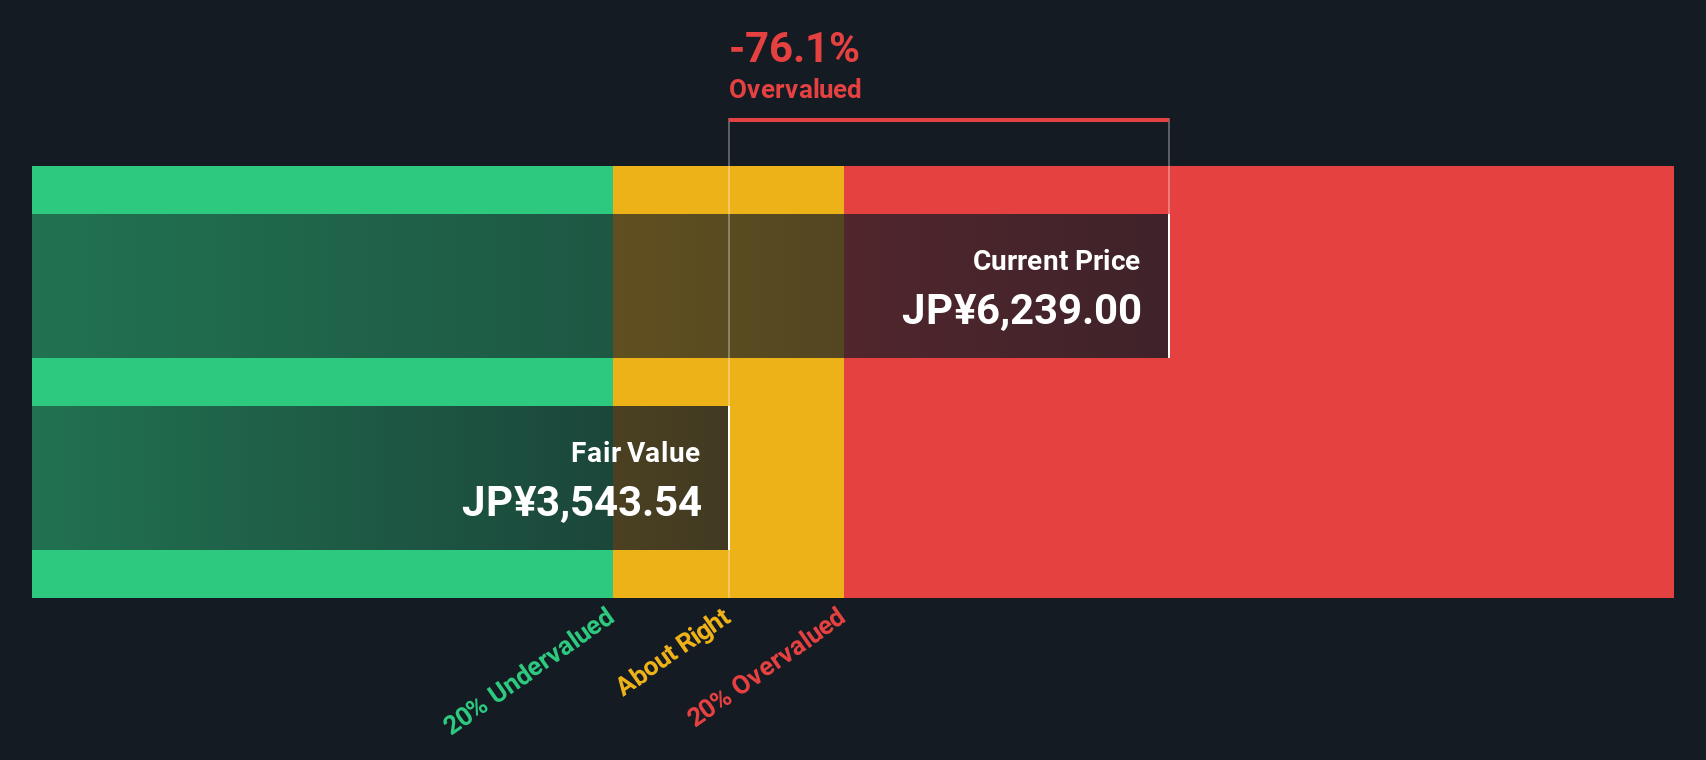
After running Nomura Research Institute through a DCF calculation using the 2 Stage Free Cash Flow to Equity method, the estimated intrinsic value comes out to ¥3,528 per share. However, the intrinsic discount, meaning the difference between market price and estimated value, implies that the stock is currently about 61.1% overvalued.
Result: OVERVALUED
Our Discounted Cash Flow (DCF) analysis suggests Nomura Research Institute may be overvalued by 61.1%. Discover 844 undervalued stocks or create your own screener to find better value opportunities.
Approach 2: Nomura Research Institute Price vs Earnings
For profitable companies like Nomura Research Institute, the Price-to-Earnings (PE) ratio is a widely accepted valuation tool. The PE ratio shows how much investors are willing to pay for each yen of earnings, making it a useful benchmark, especially for businesses with reliable profits.
A “normal” or “fair” PE ratio depends on factors such as company growth, risk, and the overall industry outlook. Firms with stronger growth prospects or lower perceived risks typically justify higher PE ratios, while slower-growing or riskier companies tend to have lower ones.
Nomura Research Institute currently trades at a PE ratio of 32.05x. This is noticeably higher than both the IT industry average of 17.30x and the peer average of 28.87x. On the surface, this premium could suggest overvaluation, but context is crucial.
To provide that context, Simply Wall St calculates a proprietary “Fair Ratio.” For Nomura Research Institute, this is 30.69x. Unlike a simple industry or peer comparison, the Fair Ratio factors in the company’s earnings growth, profit margin, industry segment, market capitalization, and risk profile. This means it more accurately reflects what investors should pay, not just what others in the sector are paying.
Comparing Nomura Research Institute’s current PE (32.05x) to its Fair Ratio (30.69x), the difference is relatively minor. This suggests the stock’s valuation is in line with its underlying performance and prospects.
Result: ABOUT RIGHT

PE ratios tell one story, but what if the real opportunity lies elsewhere? Discover 1405 companies where insiders are betting big on explosive growth.
Upgrade Your Decision Making: Choose your Nomura Research Institute Narrative
Earlier we mentioned that there is an even better way to understand valuation, so let us introduce you to Narratives. A Narrative is a simple and effective tool that lets you put a story—your perspective—behind the numbers by connecting assumptions about Nomura Research Institute’s future revenue, earnings, margins, and ultimately its fair value.
Narratives bring your investment thesis to life by linking a company’s story to a detailed financial forecast, which then determines what you believe is a reasonable valuation. Used by millions of investors within Simply Wall St’s Community page, Narratives make it easy to map your viewpoint, explore others’ perspectives, and see how your expected fair value compares to the current share price.
Because Narratives update automatically as new information comes in, such as fresh earnings reports or major news, you can quickly see if your outlook and value estimate for Nomura Research Institute should change, helping you decide if it is the right moment to buy or sell.
For example, some investors expect international expansion to drive future profits and place their fair value target at ¥6,800, while others focus on risks from rising mortgage rates or property sales and see fair value closer to ¥4,900. Narratives let you test your own view and see how it stacks up in real time.
Do you think there's more to the story for Nomura Research Institute? Head over to our Community to see what others are saying!
This article by Simply Wall St is general in nature. We provide commentary based on historical data and analyst forecasts only using an unbiased methodology and our articles are not intended to be financial advice. It does not constitute a recommendation to buy or sell any stock, and does not take account of your objectives, or your financial situation. We aim to bring you long-term focused analysis driven by fundamental data. Note that our analysis may not factor in the latest price-sensitive company announcements or qualitative material. Simply Wall St has no position in any stocks mentioned.
Valuation is complex, but we're here to simplify it.
Discover if Nomura Research Institute might be undervalued or overvalued with our detailed analysis, featuring fair value estimates, potential risks, dividends, insider trades, and its financial condition.
Access Free AnalysisHave feedback on this article? Concerned about the content? Get in touch with us directly. Alternatively, email editorial-team@simplywallst.com
About TSE:4307
Nomura Research Institute
Provides consulting, financial information technology (IT) solutions, industrial IT solutions, and IT platform services in Japan and internationally.
Solid track record with excellent balance sheet and pays a dividend.
Similar Companies
Market Insights

Advertisement
Community Narratives
The company that turned a verb into a global necessity and basically runs the modern internet, digital ads, smartphones, maps, and AI.
Fair Value US$300.00|5.2% undervalued
OS
Community Contributor
Flowers Foods Pays A Fair Price For Health
Fair Value US$16.12|24.9% undervalued
NV
Community Contributor
TMX Group will thrive with 33.3% profit margin and enduring market moat
Fair Value CA$49.90|3.3% overvalued
LI
Community Contributor
The "Molecular Pencil": Why Beam's Technology is Built to Win
Fair Value US$65.01|64.5% undervalued
DA
Community Contributor