
Advertisement
Legendary fund manager Li Lu (who Charlie Munger backed) once said, 'The biggest investment risk is not the volatility of prices, but whether you will suffer a permanent loss of capital.' So it seems the smart money knows that debt - which is usually involved in bankruptcies - is a very important factor, when you assess how risky a company is. We can see that Kaizen Platform, Inc. (TSE:4170) does use debt in its business. But is this debt a concern to shareholders?
Why Does Debt Bring Risk?
Generally speaking, debt only becomes a real problem when a company can't easily pay it off, either by raising capital or with its own cash flow. In the worst case scenario, a company can go bankrupt if it cannot pay its creditors. While that is not too common, we often do see indebted companies permanently diluting shareholders because lenders force them to raise capital at a distressed price. Having said that, the most common situation is where a company manages its debt reasonably well - and to its own advantage. The first step when considering a company's debt levels is to consider its cash and debt together.
Check out our latest analysis for Kaizen Platform
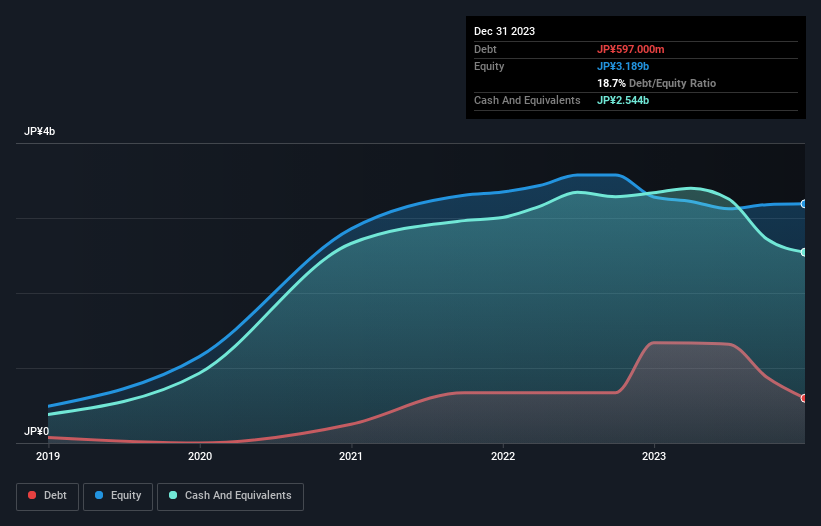
What Is Kaizen Platform's Net Debt?
You can click the graphic below for the historical numbers, but it shows that Kaizen Platform had JP¥597.0m of debt in December 2023, down from JP¥1.34b, one year before. However, its balance sheet shows it holds JP¥2.54b in cash, so it actually has JP¥1.95b net cash.
How Strong Is Kaizen Platform's Balance Sheet?
The latest balance sheet data shows that Kaizen Platform had liabilities of JP¥861.0m due within a year, and liabilities of JP¥319.0m falling due after that. Offsetting this, it had JP¥2.54b in cash and JP¥679.0m in receivables that were due within 12 months. So it actually has JP¥2.04b more liquid assets than total liabilities.
This excess liquidity is a great indication that Kaizen Platform's balance sheet is almost as strong as Fort Knox. Having regard to this fact, we think its balance sheet is as strong as an ox. Succinctly put, Kaizen Platform boasts net cash, so it's fair to say it does not have a heavy debt load! There's no doubt that we learn most about debt from the balance sheet. But you can't view debt in total isolation; since Kaizen Platform will need earnings to service that debt. So if you're keen to discover more about its earnings, it might be worth checking out this graph of its long term earnings trend.
Over 12 months, Kaizen Platform reported revenue of JP¥4.3b, which is a gain of 63%, although it did not report any earnings before interest and tax. With any luck the company will be able to grow its way to profitability.
So How Risky Is Kaizen Platform?
We have no doubt that loss making companies are, in general, riskier than profitable ones. And in the last year Kaizen Platform had an earnings before interest and tax (EBIT) loss, truth be told. And over the same period it saw negative free cash outflow of JP¥19m and booked a JP¥21m accounting loss. But the saving grace is the JP¥1.95b on the balance sheet. That kitty means the company can keep spending for growth for at least two years, at current rates. Kaizen Platform's revenue growth shone bright over the last year, so it may well be in a position to turn a profit in due course. Pre-profit companies are often risky, but they can also offer great rewards. When analysing debt levels, the balance sheet is the obvious place to start. However, not all investment risk resides within the balance sheet - far from it. For instance, we've identified 2 warning signs for Kaizen Platform (1 is significant) you should be aware of.
If, after all that, you're more interested in a fast growing company with a rock-solid balance sheet, then check out our list of net cash growth stocks without delay.
Valuation is complex, but we're here to simplify it.
Discover if Kaizen Platform might be undervalued or overvalued with our detailed analysis, featuring fair value estimates, potential risks, dividends, insider trades, and its financial condition.
Access Free AnalysisHave feedback on this article? Concerned about the content? Get in touch with us directly. Alternatively, email editorial-team (at) simplywallst.com.
This article by Simply Wall St is general in nature. We provide commentary based on historical data and analyst forecasts only using an unbiased methodology and our articles are not intended to be financial advice. It does not constitute a recommendation to buy or sell any stock, and does not take account of your objectives, or your financial situation. We aim to bring you long-term focused analysis driven by fundamental data. Note that our analysis may not factor in the latest price-sensitive company announcements or qualitative material. Simply Wall St has no position in any stocks mentioned.
About TSE:4170
Excellent balance sheet with low risk.
Market Insights

Advertisement
Community Narratives
MINISO's fair value is projected at 26.69 with an anticipated PE ratio shift of 20x
Fair Value US$24.03|11.0% undervalued
BE
Community Contributor
Procter & Gamble: A Dividend Giant Facing Slowing Growth
Fair Value US$119.81|23.3% overvalued
AN
Community Contributor
Eli Lilly's Future Growth Driven by Tirzepatide and Favorable Market Conditions
Fair Value US$1.19k|13.8% undervalued
EA
Community Contributor