
Advertisement
BlueMeme Inc.'s (TSE:4069) 31% Dip Still Leaving Some Shareholders Feeling Restless Over Its P/ERatio
BlueMeme Inc. (TSE:4069) shareholders that were waiting for something to happen have been dealt a blow with a 31% share price drop in the last month. Looking at the bigger picture, even after this poor month the stock is up 53% in the last year.
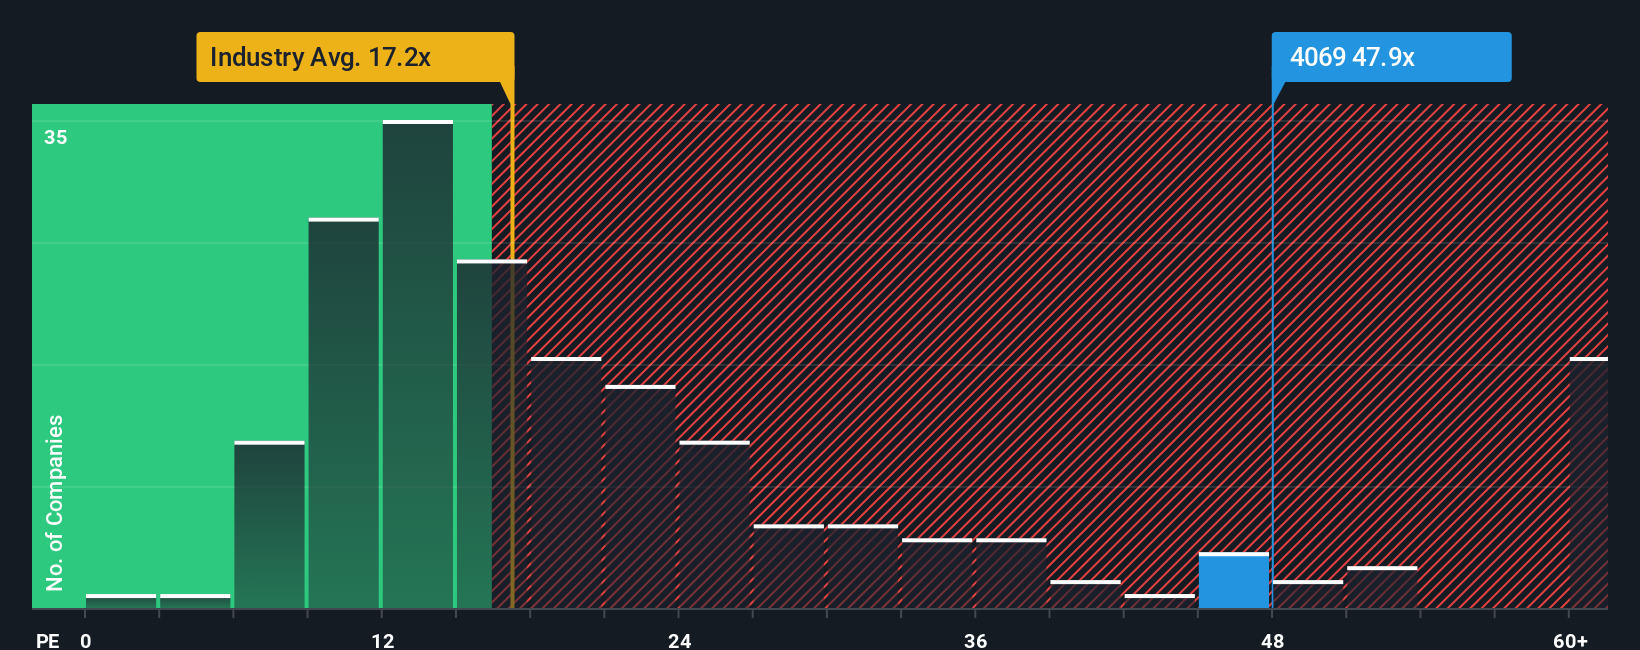
Even after such a large drop in price, BlueMeme may still be sending very bearish signals at the moment with a price-to-earnings (or "P/E") ratio of 47.9x, since almost half of all companies in Japan have P/E ratios under 14x and even P/E's lower than 10x are not unusual. Although, it's not wise to just take the P/E at face value as there may be an explanation why it's so lofty.
The earnings growth achieved at BlueMeme over the last year would be more than acceptable for most companies. It might be that many expect the respectable earnings performance to beat most other companies over the coming period, which has increased investors’ willingness to pay up for the stock. If not, then existing shareholders may be a little nervous about the viability of the share price.
See our latest analysis for BlueMeme
How Is BlueMeme's Growth Trending?
BlueMeme's P/E ratio would be typical for a company that's expected to deliver very strong growth, and importantly, perform much better than the market.
Retrospectively, the last year delivered an exceptional 28% gain to the company's bottom line. However, this wasn't enough as the latest three year period has seen a very unpleasant 60% drop in EPS in aggregate. So unfortunately, we have to acknowledge that the company has not done a great job of growing earnings over that time.
Weighing that medium-term earnings trajectory against the broader market's one-year forecast for expansion of 9.8% shows it's an unpleasant look.
In light of this, it's alarming that BlueMeme's P/E sits above the majority of other companies. It seems most investors are ignoring the recent poor growth rate and are hoping for a turnaround in the company's business prospects. There's a very good chance existing shareholders are setting themselves up for future disappointment if the P/E falls to levels more in line with the recent negative growth rates.
The Bottom Line On BlueMeme's P/E
Even after such a strong price drop, BlueMeme's P/E still exceeds the rest of the market significantly. It's argued the price-to-earnings ratio is an inferior measure of value within certain industries, but it can be a powerful business sentiment indicator.
Our examination of BlueMeme revealed its shrinking earnings over the medium-term aren't impacting its high P/E anywhere near as much as we would have predicted, given the market is set to grow. When we see earnings heading backwards and underperforming the market forecasts, we suspect the share price is at risk of declining, sending the high P/E lower. If recent medium-term earnings trends continue, it will place shareholders' investments at significant risk and potential investors in danger of paying an excessive premium.
Before you settle on your opinion, we've discovered 3 warning signs for BlueMeme (2 are concerning!) that you should be aware of.
It's important to make sure you look for a great company, not just the first idea you come across. So take a peek at this free list of interesting companies with strong recent earnings growth (and a low P/E).
Valuation is complex, but we're here to simplify it.
Discover if BlueMeme might be undervalued or overvalued with our detailed analysis, featuring fair value estimates, potential risks, dividends, insider trades, and its financial condition.
Access Free AnalysisHave feedback on this article? Concerned about the content? Get in touch with us directly. Alternatively, email editorial-team (at) simplywallst.com.
This article by Simply Wall St is general in nature. We provide commentary based on historical data and analyst forecasts only using an unbiased methodology and our articles are not intended to be financial advice. It does not constitute a recommendation to buy or sell any stock, and does not take account of your objectives, or your financial situation. We aim to bring you long-term focused analysis driven by fundamental data. Note that our analysis may not factor in the latest price-sensitive company announcements or qualitative material. Simply Wall St has no position in any stocks mentioned.
About TSE:4069
BlueMeme
Engages in the low code technology and DX business with a focus on agile methods in Japan.
Proven track record with adequate balance sheet.
Market Insights

Advertisement
Community Narratives
MINISO's fair value is projected at 26.69 with an anticipated PE ratio shift of 20x
Fair Value US$24.03|11.4% undervalued
BE
Community Contributor
Procter & Gamble: A Dividend Giant Facing Slowing Growth
Fair Value US$119.81|23.5% overvalued
AN
Community Contributor
Eli Lilly's Future Growth Driven by Tirzepatide and Favorable Market Conditions
Fair Value US$1.19k|14.0% undervalued
EA
Community Contributor