
Advertisement
Warren Buffett famously said, 'Volatility is far from synonymous with risk.' When we think about how risky a company is, we always like to look at its use of debt, since debt overload can lead to ruin. As with many other companies Ecomott Inc. (TSE:3987) makes use of debt. But is this debt a concern to shareholders?
When Is Debt Dangerous?
Debt assists a business until the business has trouble paying it off, either with new capital or with free cash flow. Part and parcel of capitalism is the process of 'creative destruction' where failed businesses are mercilessly liquidated by their bankers. However, a more common (but still painful) scenario is that it has to raise new equity capital at a low price, thus permanently diluting shareholders. Of course, plenty of companies use debt to fund growth, without any negative consequences. When we examine debt levels, we first consider both cash and debt levels, together.
See our latest analysis for Ecomott
What Is Ecomott's Debt?
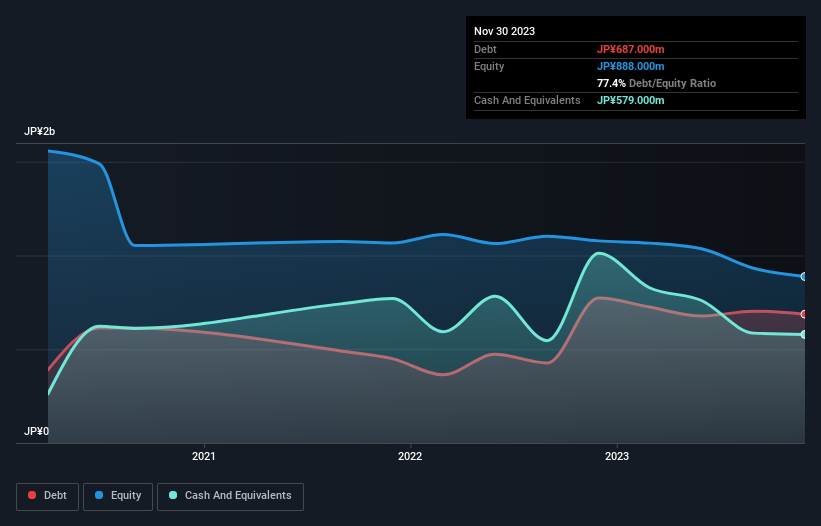
The image below, which you can click on for greater detail, shows that Ecomott had debt of JP¥687.0m at the end of November 2023, a reduction from JP¥773.0m over a year. However, because it has a cash reserve of JP¥579.0m, its net debt is less, at about JP¥108.0m.
How Strong Is Ecomott's Balance Sheet?
The latest balance sheet data shows that Ecomott had liabilities of JP¥1.05b due within a year, and liabilities of JP¥396.0m falling due after that. On the other hand, it had cash of JP¥579.0m and JP¥606.0m worth of receivables due within a year. So its liabilities total JP¥258.0m more than the combination of its cash and short-term receivables.
Of course, Ecomott has a market capitalization of JP¥2.35b, so these liabilities are probably manageable. However, we do think it is worth keeping an eye on its balance sheet strength, as it may change over time. When analysing debt levels, the balance sheet is the obvious place to start. But it is Ecomott's earnings that will influence how the balance sheet holds up in the future. So when considering debt, it's definitely worth looking at the earnings trend. Click here for an interactive snapshot.
Over 12 months, Ecomott reported revenue of JP¥2.7b, which is a gain of 19%, although it did not report any earnings before interest and tax. We usually like to see faster growth from unprofitable companies, but each to their own.
Caveat Emptor
Importantly, Ecomott had an earnings before interest and tax (EBIT) loss over the last year. To be specific the EBIT loss came in at JP¥112m. Considering that alongside the liabilities mentioned above does not give us much confidence that company should be using so much debt. Quite frankly we think the balance sheet is far from match-fit, although it could be improved with time. Another cause for caution is that is bled JP¥211m in negative free cash flow over the last twelve months. So in short it's a really risky stock. The balance sheet is clearly the area to focus on when you are analysing debt. But ultimately, every company can contain risks that exist outside of the balance sheet. For example Ecomott has 3 warning signs (and 1 which shouldn't be ignored) we think you should know about.
At the end of the day, it's often better to focus on companies that are free from net debt. You can access our special list of such companies (all with a track record of profit growth). It's free.
Valuation is complex, but we're here to simplify it.
Discover if Ecomott might be undervalued or overvalued with our detailed analysis, featuring fair value estimates, potential risks, dividends, insider trades, and its financial condition.
Access Free AnalysisHave feedback on this article? Concerned about the content? Get in touch with us directly. Alternatively, email editorial-team (at) simplywallst.com.
This article by Simply Wall St is general in nature. We provide commentary based on historical data and analyst forecasts only using an unbiased methodology and our articles are not intended to be financial advice. It does not constitute a recommendation to buy or sell any stock, and does not take account of your objectives, or your financial situation. We aim to bring you long-term focused analysis driven by fundamental data. Note that our analysis may not factor in the latest price-sensitive company announcements or qualitative material. Simply Wall St has no position in any stocks mentioned.
About TSE:3987
Ecomott
Engages in the Internet of Things (IoT) integration business in Japan.
Slight risk and slightly overvalued.
Market Insights

Advertisement
Community Narratives
MINISO's fair value is projected at 26.69 with an anticipated PE ratio shift of 20x
Fair Value US$24.03|9.0% undervalued
BE
Community Contributor
Procter & Gamble: A Dividend Giant Facing Slowing Growth
Fair Value US$119.81|23.5% overvalued
AN
Community Contributor
Eli Lilly's Future Growth Driven by Tirzepatide and Favorable Market Conditions
Fair Value US$1.19k|14.4% undervalued
EA
Community Contributor