
Advertisement
Legendary fund manager Li Lu (who Charlie Munger backed) once said, 'The biggest investment risk is not the volatility of prices, but whether you will suffer a permanent loss of capital.' When we think about how risky a company is, we always like to look at its use of debt, since debt overload can lead to ruin. As with many other companies TEMONA.inc. (TSE:3985) makes use of debt. But the more important question is: how much risk is that debt creating?
What Risk Does Debt Bring?
Debt is a tool to help businesses grow, but if a business is incapable of paying off its lenders, then it exists at their mercy. Ultimately, if the company can't fulfill its legal obligations to repay debt, shareholders could walk away with nothing. While that is not too common, we often do see indebted companies permanently diluting shareholders because lenders force them to raise capital at a distressed price. Having said that, the most common situation is where a company manages its debt reasonably well - and to its own advantage. When we think about a company's use of debt, we first look at cash and debt together.
View our latest analysis for TEMONA.inc
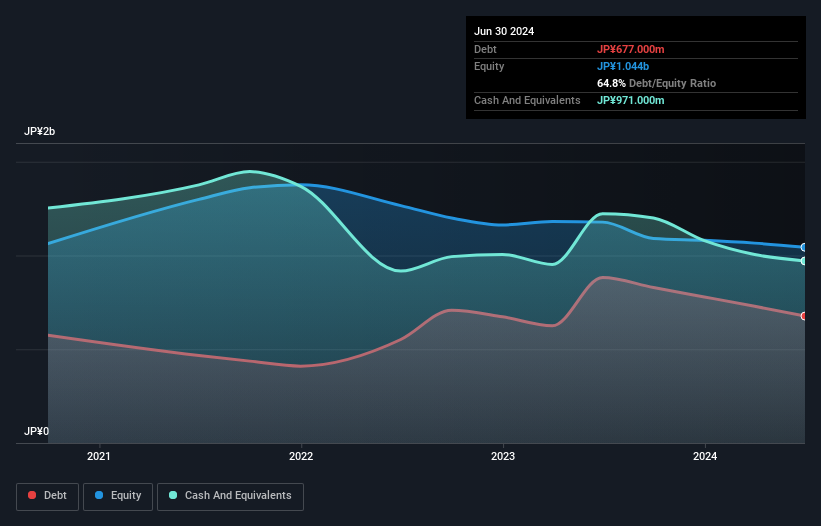
What Is TEMONA.inc's Debt?
As you can see below, TEMONA.inc had JP¥677.0m of debt at June 2024, down from JP¥883.0m a year prior. However, it does have JP¥971.0m in cash offsetting this, leading to net cash of JP¥294.0m.
How Healthy Is TEMONA.inc's Balance Sheet?
Zooming in on the latest balance sheet data, we can see that TEMONA.inc had liabilities of JP¥596.0m due within 12 months and liabilities of JP¥330.0m due beyond that. Offsetting this, it had JP¥971.0m in cash and JP¥172.0m in receivables that were due within 12 months. So it can boast JP¥217.0m more liquid assets than total liabilities.
This short term liquidity is a sign that TEMONA.inc could probably pay off its debt with ease, as its balance sheet is far from stretched. Simply put, the fact that TEMONA.inc has more cash than debt is arguably a good indication that it can manage its debt safely. There's no doubt that we learn most about debt from the balance sheet. But it is TEMONA.inc's earnings that will influence how the balance sheet holds up in the future. So when considering debt, it's definitely worth looking at the earnings trend. Click here for an interactive snapshot.
In the last year TEMONA.inc had a loss before interest and tax, and actually shrunk its revenue by 24%, to JP¥1.9b. That makes us nervous, to say the least.
So How Risky Is TEMONA.inc?
By their very nature companies that are losing money are more risky than those with a long history of profitability. And we do note that TEMONA.inc had an earnings before interest and tax (EBIT) loss, over the last year. And over the same period it saw negative free cash outflow of JP¥56m and booked a JP¥142m accounting loss. While this does make the company a bit risky, it's important to remember it has net cash of JP¥294.0m. That means it could keep spending at its current rate for more than two years. Even though its balance sheet seems sufficiently liquid, debt always makes us a little nervous if a company doesn't produce free cash flow regularly. The balance sheet is clearly the area to focus on when you are analysing debt. But ultimately, every company can contain risks that exist outside of the balance sheet. For example TEMONA.inc has 2 warning signs (and 1 which is a bit concerning) we think you should know about.
At the end of the day, it's often better to focus on companies that are free from net debt. You can access our special list of such companies (all with a track record of profit growth). It's free.
Valuation is complex, but we're here to simplify it.
Discover if TEMONA.inc might be undervalued or overvalued with our detailed analysis, featuring fair value estimates, potential risks, dividends, insider trades, and its financial condition.
Access Free AnalysisHave feedback on this article? Concerned about the content? Get in touch with us directly. Alternatively, email editorial-team (at) simplywallst.com.
This article by Simply Wall St is general in nature. We provide commentary based on historical data and analyst forecasts only using an unbiased methodology and our articles are not intended to be financial advice. It does not constitute a recommendation to buy or sell any stock, and does not take account of your objectives, or your financial situation. We aim to bring you long-term focused analysis driven by fundamental data. Note that our analysis may not factor in the latest price-sensitive company announcements or qualitative material. Simply Wall St has no position in any stocks mentioned.
About TSE:3985
Excellent balance sheet with acceptable track record.
Market Insights

Advertisement
Community Narratives
MINISO's fair value is projected at 26.69 with an anticipated PE ratio shift of 20x
Fair Value US$24.03|11.0% undervalued
BE
Community Contributor
Procter & Gamble: A Dividend Giant Facing Slowing Growth
Fair Value US$119.81|23.3% overvalued
AN
Community Contributor
Eli Lilly's Future Growth Driven by Tirzepatide and Favorable Market Conditions
Fair Value US$1.19k|13.8% undervalued
EA
Community Contributor