
Advertisement
Segue Group Co., Ltd. (TSE:3968) Stock Rockets 125% As Investors Are Less Pessimistic Than Expected
The Segue Group Co., Ltd. (TSE:3968) share price has done very well over the last month, posting an excellent gain of 125%. The last month tops off a massive increase of 165% in the last year.
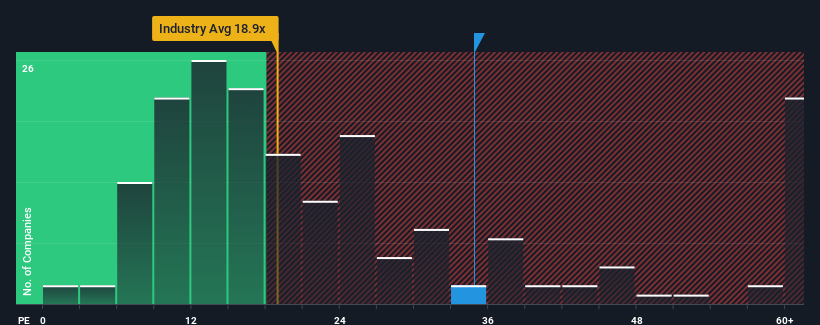
After such a large jump in price, Segue Group may be sending very bearish signals at the moment with a price-to-earnings (or "P/E") ratio of 34.9x, since almost half of all companies in Japan have P/E ratios under 14x and even P/E's lower than 9x are not unusual. Nonetheless, we'd need to dig a little deeper to determine if there is a rational basis for the highly elevated P/E.
For instance, Segue Group's receding earnings in recent times would have to be some food for thought. One possibility is that the P/E is high because investors think the company will still do enough to outperform the broader market in the near future. You'd really hope so, otherwise you're paying a pretty hefty price for no particular reason.
See our latest analysis for Segue Group
Does Growth Match The High P/E?
The only time you'd be truly comfortable seeing a P/E as steep as Segue Group's is when the company's growth is on track to outshine the market decidedly.
Taking a look back first, the company's earnings per share growth last year wasn't something to get excited about as it posted a disappointing decline of 11%. The last three years don't look nice either as the company has shrunk EPS by 65% in aggregate. Therefore, it's fair to say the earnings growth recently has been undesirable for the company.
Comparing that to the market, which is predicted to deliver 11% growth in the next 12 months, the company's downward momentum based on recent medium-term earnings results is a sobering picture.
In light of this, it's alarming that Segue Group's P/E sits above the majority of other companies. Apparently many investors in the company are way more bullish than recent times would indicate and aren't willing to let go of their stock at any price. There's a very good chance existing shareholders are setting themselves up for future disappointment if the P/E falls to levels more in line with the recent negative growth rates.
The Bottom Line On Segue Group's P/E
The strong share price surge has got Segue Group's P/E rushing to great heights as well. We'd say the price-to-earnings ratio's power isn't primarily as a valuation instrument but rather to gauge current investor sentiment and future expectations.
We've established that Segue Group currently trades on a much higher than expected P/E since its recent earnings have been in decline over the medium-term. When we see earnings heading backwards and underperforming the market forecasts, we suspect the share price is at risk of declining, sending the high P/E lower. Unless the recent medium-term conditions improve markedly, it's very challenging to accept these prices as being reasonable.
You need to take note of risks, for example - Segue Group has 3 warning signs (and 1 which can't be ignored) we think you should know about.
You might be able to find a better investment than Segue Group. If you want a selection of possible candidates, check out this free list of interesting companies that trade on a low P/E (but have proven they can grow earnings).
New: Manage All Your Stock Portfolios in One Place
We've created the ultimate portfolio companion for stock investors, and it's free.
• Connect an unlimited number of Portfolios and see your total in one currency
• Be alerted to new Warning Signs or Risks via email or mobile
• Track the Fair Value of your stocks
Have feedback on this article? Concerned about the content? Get in touch with us directly. Alternatively, email editorial-team (at) simplywallst.com.
This article by Simply Wall St is general in nature. We provide commentary based on historical data and analyst forecasts only using an unbiased methodology and our articles are not intended to be financial advice. It does not constitute a recommendation to buy or sell any stock, and does not take account of your objectives, or your financial situation. We aim to bring you long-term focused analysis driven by fundamental data. Note that our analysis may not factor in the latest price-sensitive company announcements or qualitative material. Simply Wall St has no position in any stocks mentioned.
About TSE:3968
Segue Group
Provides design, construction, operation, and maintenance services related to IT infrastructure and network security products in Japan.
Proven track record with adequate balance sheet.
Market Insights

Advertisement
Community Narratives
MicroVision will explode future revenue by 380.37% with a vision towards success
Fair Value US$60|98.4% undervalued
TH
Community Contributor
The Indispensable Artery for a New North American Economy
Fair Value CA$132.87|0.7% overvalued
TI
Community Contributor
Recently Updated Narratives
NI

niteco on Texas Instruments ·
Engineered for Stability. Positioned for Growth.
Fair Value:US$314.4446.5% undervalued
1 followerusers have followed this narrative
0 commentsusers have commented on this narrative
0 likesusers have liked this narrative
BE


Bejgal on MINISO Group Holding ·
MINISO's fair value is projected at 26.69 with an anticipated PE ratio shift of 20x
Fair Value:US$28.1829.5% undervalued
46 followersusers have followed this narrative
3 commentsusers have commented on this narrative
0 likesusers have liked this narrative
BE

Bejgal on Fiverr International ·
Fiverr International will transform the freelance industry with AI-powered growth
Fair Value:US$36.8143.1% undervalued
79 followersusers have followed this narrative
7 commentsusers have commented on this narrative
0 likesusers have liked this narrative
Popular Narratives
TH

TheWallstreetKing on MicroVision ·
MicroVision will explode future revenue by 380.37% with a vision towards success
Fair Value:US$6098.4% undervalued
109 followersusers have followed this narrative
10 commentsusers have commented on this narrative
21 likesusers have liked this narrative
AN


AnalystConsensusTarget on NVIDIA ·
NVDA: Expanding AI Demand Will Drive Major Data Center Investments Through 2026
Fair Value:US$250.3929.3% undervalued
938 followersusers have followed this narrative
6 commentsusers have commented on this narrative
24 likesusers have liked this narrative
OS


oscargarcia on Alphabet ·
The company that turned a verb into a global necessity and basically runs the modern internet, digital ads, smartphones, maps, and AI.
Fair Value:US$3405.8% undervalued
145 followersusers have followed this narrative
6 commentsusers have commented on this narrative
18 likesusers have liked this narrative