
Advertisement
Subdued Growth No Barrier To CELSYS, Inc. (TSE:3663) With Shares Advancing 37%
CELSYS, Inc. (TSE:3663) shareholders would be excited to see that the share price has had a great month, posting a 37% gain and recovering from prior weakness. Looking back a bit further, it's encouraging to see the stock is up 32% in the last year.
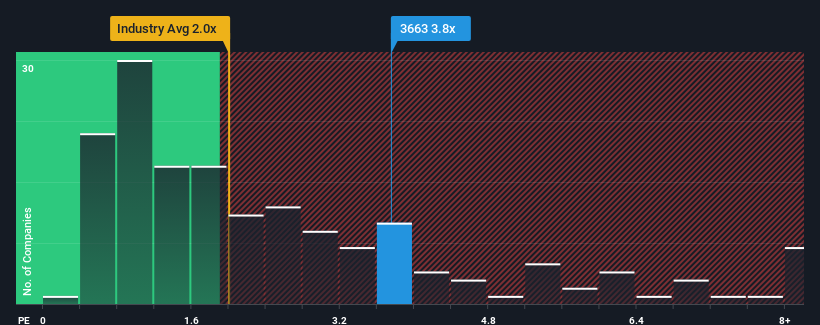
Since its price has surged higher, you could be forgiven for thinking CELSYS is a stock not worth researching with a price-to-sales ratios (or "P/S") of 3.8x, considering almost half the companies in Japan's Software industry have P/S ratios below 2x. However, the P/S might be high for a reason and it requires further investigation to determine if it's justified.
See our latest analysis for CELSYS
What Does CELSYS' Recent Performance Look Like?
For example, consider that CELSYS' financial performance has been poor lately as its revenue has been in decline. One possibility is that the P/S is high because investors think the company will still do enough to outperform the broader industry in the near future. However, if this isn't the case, investors might get caught out paying too much for the stock.
Although there are no analyst estimates available for CELSYS, take a look at this free data-rich visualisation to see how the company stacks up on earnings, revenue and cash flow.Is There Enough Revenue Growth Forecasted For CELSYS?
The only time you'd be truly comfortable seeing a P/S as high as CELSYS' is when the company's growth is on track to outshine the industry.
Retrospectively, the last year delivered a frustrating 1.8% decrease to the company's top line. This has soured the latest three-year period, which nevertheless managed to deliver a decent 15% overall rise in revenue. So we can start by confirming that the company has generally done a good job of growing revenue over that time, even though it had some hiccups along the way.
Comparing that to the industry, which is predicted to deliver 13% growth in the next 12 months, the company's momentum is weaker, based on recent medium-term annualised revenue results.
With this information, we find it concerning that CELSYS is trading at a P/S higher than the industry. It seems most investors are ignoring the fairly limited recent growth rates and are hoping for a turnaround in the company's business prospects. There's a good chance existing shareholders are setting themselves up for future disappointment if the P/S falls to levels more in line with recent growth rates.
What Does CELSYS' P/S Mean For Investors?
CELSYS shares have taken a big step in a northerly direction, but its P/S is elevated as a result. We'd say the price-to-sales ratio's power isn't primarily as a valuation instrument but rather to gauge current investor sentiment and future expectations.
The fact that CELSYS currently trades on a higher P/S relative to the industry is an oddity, since its recent three-year growth is lower than the wider industry forecast. Right now we aren't comfortable with the high P/S as this revenue performance isn't likely to support such positive sentiment for long. If recent medium-term revenue trends continue, it will place shareholders' investments at significant risk and potential investors in danger of paying an excessive premium.
Before you take the next step, you should know about the 1 warning sign for CELSYS that we have uncovered.
If these risks are making you reconsider your opinion on CELSYS, explore our interactive list of high quality stocks to get an idea of what else is out there.
New: AI Stock Screener & Alerts
Our new AI Stock Screener scans the market every day to uncover opportunities.
• Dividend Powerhouses (3%+ Yield)
• Undervalued Small Caps with Insider Buying
• High growth Tech and AI Companies
Or build your own from over 50 metrics.
Have feedback on this article? Concerned about the content? Get in touch with us directly. Alternatively, email editorial-team (at) simplywallst.com.
This article by Simply Wall St is general in nature. We provide commentary based on historical data and analyst forecasts only using an unbiased methodology and our articles are not intended to be financial advice. It does not constitute a recommendation to buy or sell any stock, and does not take account of your objectives, or your financial situation. We aim to bring you long-term focused analysis driven by fundamental data. Note that our analysis may not factor in the latest price-sensitive company announcements or qualitative material. Simply Wall St has no position in any stocks mentioned.
About TSE:3663
Flawless balance sheet with reasonable growth potential.
Market Insights

Advertisement
Community Narratives
MicroVision will explode future revenue by 380.37% with a vision towards success
Fair Value US$60.00|98.5% undervalued
TH
Community Contributor
The Indispensable Artery for a New North American Economy
Fair Value CA$132.87|2.3% undervalued
TI
Community Contributor