
Advertisement
There's Reason For Concern Over Forside Co.,Ltd.'s (TSE:2330) Massive 407% Price Jump
The Forside Co.,Ltd. (TSE:2330) share price has done very well over the last month, posting an excellent gain of 407%. The last 30 days were the cherry on top of the stock's 436% gain in the last year, which is nothing short of spectacular.
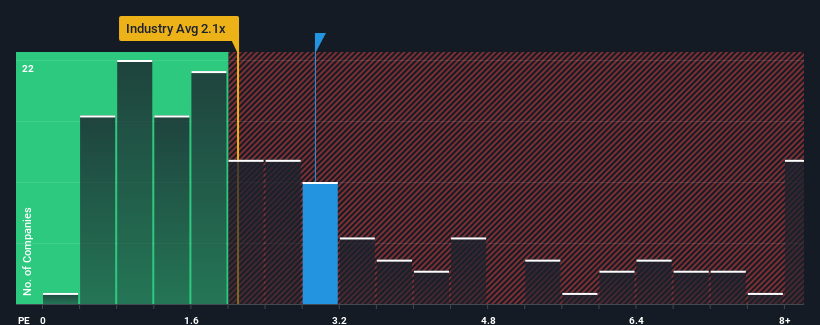
Since its price has surged higher, you could be forgiven for thinking ForsideLtd is a stock not worth researching with a price-to-sales ratios (or "P/S") of 2.9x, considering almost half the companies in Japan's Software industry have P/S ratios below 2.1x. However, the P/S might be high for a reason and it requires further investigation to determine if it's justified.
See our latest analysis for ForsideLtd
How Has ForsideLtd Performed Recently?
For example, consider that ForsideLtd's financial performance has been poor lately as its revenue has been in decline. Perhaps the market believes the company can do enough to outperform the rest of the industry in the near future, which is keeping the P/S ratio high. You'd really hope so, otherwise you're paying a pretty hefty price for no particular reason.
Want the full picture on earnings, revenue and cash flow for the company? Then our free report on ForsideLtd will help you shine a light on its historical performance.Is There Enough Revenue Growth Forecasted For ForsideLtd?
ForsideLtd's P/S ratio would be typical for a company that's expected to deliver solid growth, and importantly, perform better than the industry.
In reviewing the last year of financials, we were disheartened to see the company's revenues fell to the tune of 3.4%. Regardless, revenue has managed to lift by a handy 19% in aggregate from three years ago, thanks to the earlier period of growth. So we can start by confirming that the company has generally done a good job of growing revenue over that time, even though it had some hiccups along the way.
Comparing that to the industry, which is predicted to deliver 15% growth in the next 12 months, the company's momentum is weaker, based on recent medium-term annualised revenue results.
With this information, we find it concerning that ForsideLtd is trading at a P/S higher than the industry. Apparently many investors in the company are way more bullish than recent times would indicate and aren't willing to let go of their stock at any price. Only the boldest would assume these prices are sustainable as a continuation of recent revenue trends is likely to weigh heavily on the share price eventually.
What Does ForsideLtd's P/S Mean For Investors?
The large bounce in ForsideLtd's shares has lifted the company's P/S handsomely. Typically, we'd caution against reading too much into price-to-sales ratios when settling on investment decisions, though it can reveal plenty about what other market participants think about the company.
Our examination of ForsideLtd revealed its poor three-year revenue trends aren't detracting from the P/S as much as we though, given they look worse than current industry expectations. When we see slower than industry revenue growth but an elevated P/S, there's considerable risk of the share price declining, sending the P/S lower. Unless there is a significant improvement in the company's medium-term performance, it will be difficult to prevent the P/S ratio from declining to a more reasonable level.
You should always think about risks. Case in point, we've spotted 4 warning signs for ForsideLtd you should be aware of, and 1 of them is a bit concerning.
If companies with solid past earnings growth is up your alley, you may wish to see this free collection of other companies with strong earnings growth and low P/E ratios.
New: AI Stock Screener & Alerts
Our new AI Stock Screener scans the market every day to uncover opportunities.
• Dividend Powerhouses (3%+ Yield)
• Undervalued Small Caps with Insider Buying
• High growth Tech and AI Companies
Or build your own from over 50 metrics.
Have feedback on this article? Concerned about the content? Get in touch with us directly. Alternatively, email editorial-team (at) simplywallst.com.
This article by Simply Wall St is general in nature. We provide commentary based on historical data and analyst forecasts only using an unbiased methodology and our articles are not intended to be financial advice. It does not constitute a recommendation to buy or sell any stock, and does not take account of your objectives, or your financial situation. We aim to bring you long-term focused analysis driven by fundamental data. Note that our analysis may not factor in the latest price-sensitive company announcements or qualitative material. Simply Wall St has no position in any stocks mentioned.
About TSE:2330
ForsideLtd
An investment holding company, engages in prize, real estate, content, event, and master rights businesses in Japan.
Flawless balance sheet with solid track record.
Market Insights

Advertisement
Community Narratives
MicroVision will explode future revenue by 380.37% with a vision towards success
Fair Value US$60|98.4% undervalued
TH
Community Contributor
The Indispensable Artery for a New North American Economy
Fair Value CA$132.87|1.6% undervalued
TI
Community Contributor
Recently Updated Narratives
BE


Bejgal on MINISO Group Holding ·
MINISO's fair value is projected at 26.69 with an anticipated PE ratio shift of 20x
Fair Value:US$26.6928.0% undervalued
44 followersusers have followed this narrative
3 commentsusers have commented on this narrative
0 likesusers have liked this narrative
TI


TickerTickle on Oracle ·
The Quiet Giant That Became AI’s Power Grid
Fair Value:US$389.8149.5% undervalued
7 followersusers have followed this narrative
0 commentsusers have commented on this narrative
0 likesusers have liked this narrative
AU

AuCA on Nova Ljubljanska Banka d.d ·
Nova Ljubljanska Banka d.d will expect a 11.2% revenue boost driving future growth
Fair Value:€20916.3% undervalued
23 followersusers have followed this narrative
3 commentsusers have commented on this narrative
0 likesusers have liked this narrative
Popular Narratives
OS


oscargarcia on Alphabet ·
The company that turned a verb into a global necessity and basically runs the modern internet, digital ads, smartphones, maps, and AI.
Fair Value:US$3404.9% undervalued
134 followersusers have followed this narrative
6 commentsusers have commented on this narrative
18 likesusers have liked this narrative
TH

TheWallstreetKing on MicroVision ·
MicroVision will explode future revenue by 380.37% with a vision towards success
Fair Value:US$6098.4% undervalued
83 followersusers have followed this narrative
10 commentsusers have commented on this narrative
18 likesusers have liked this narrative
AN


AnalystConsensusTarget on NVIDIA ·
NVDA: Expanding AI Demand Will Drive Major Data Center Investments Through 2026
Fair Value:US$232.7923.6% undervalued
920 followersusers have followed this narrative
5 commentsusers have commented on this narrative
21 likesusers have liked this narrative