
Advertisement
Slammed 27% Cross Cat Co., Ltd. (TSE:2307) Screens Well Here But There Might Be A Catch
The Cross Cat Co., Ltd. (TSE:2307) share price has softened a substantial 27% over the previous 30 days, handing back much of the gains the stock has made lately. Indeed, the recent drop has reduced its annual gain to a relatively sedate 6.5% over the last twelve months.
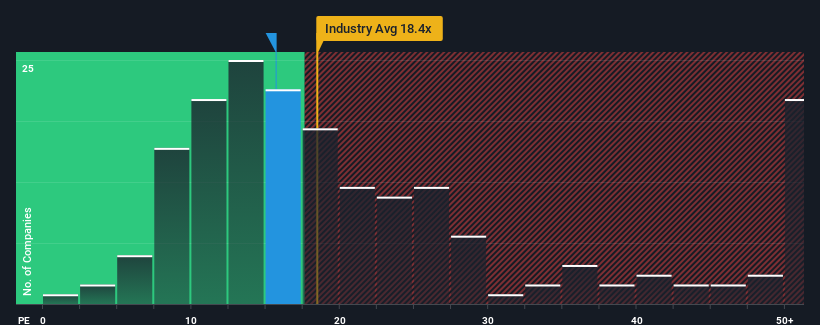
Even after such a large drop in price, it's still not a stretch to say that Cross Cat's price-to-earnings (or "P/E") ratio of 15.7x right now seems quite "middle-of-the-road" compared to the market in Japan, where the median P/E ratio is around 14x. While this might not raise any eyebrows, if the P/E ratio is not justified investors could be missing out on a potential opportunity or ignoring looming disappointment.
Earnings have risen firmly for Cross Cat recently, which is pleasing to see. One possibility is that the P/E is moderate because investors think this respectable earnings growth might not be enough to outperform the broader market in the near future. If you like the company, you'd be hoping this isn't the case so that you could potentially pick up some stock while it's not quite in favour.
View our latest analysis for Cross Cat
How Is Cross Cat's Growth Trending?
Cross Cat's P/E ratio would be typical for a company that's only expected to deliver moderate growth, and importantly, perform in line with the market.
Retrospectively, the last year delivered a decent 12% gain to the company's bottom line. This was backed up an excellent period prior to see EPS up by 309% in total over the last three years. So we can start by confirming that the company has done a great job of growing earnings over that time.
Weighing that recent medium-term earnings trajectory against the broader market's one-year forecast for expansion of 11% shows it's noticeably more attractive on an annualised basis.
With this information, we find it interesting that Cross Cat is trading at a fairly similar P/E to the market. Apparently some shareholders believe the recent performance is at its limits and have been accepting lower selling prices.
What We Can Learn From Cross Cat's P/E?
Cross Cat's plummeting stock price has brought its P/E right back to the rest of the market. It's argued the price-to-earnings ratio is an inferior measure of value within certain industries, but it can be a powerful business sentiment indicator.
We've established that Cross Cat currently trades on a lower than expected P/E since its recent three-year growth is higher than the wider market forecast. There could be some unobserved threats to earnings preventing the P/E ratio from matching this positive performance. It appears some are indeed anticipating earnings instability, because the persistence of these recent medium-term conditions would normally provide a boost to the share price.
And what about other risks? Every company has them, and we've spotted 2 warning signs for Cross Cat (of which 1 is significant!) you should know about.
You might be able to find a better investment than Cross Cat. If you want a selection of possible candidates, check out this free list of interesting companies that trade on a low P/E (but have proven they can grow earnings).
New: AI Stock Screener & Alerts
Our new AI Stock Screener scans the market every day to uncover opportunities.
• Dividend Powerhouses (3%+ Yield)
• Undervalued Small Caps with Insider Buying
• High growth Tech and AI Companies
Or build your own from over 50 metrics.
Have feedback on this article? Concerned about the content? Get in touch with us directly. Alternatively, email editorial-team (at) simplywallst.com.
This article by Simply Wall St is general in nature. We provide commentary based on historical data and analyst forecasts only using an unbiased methodology and our articles are not intended to be financial advice. It does not constitute a recommendation to buy or sell any stock, and does not take account of your objectives, or your financial situation. We aim to bring you long-term focused analysis driven by fundamental data. Note that our analysis may not factor in the latest price-sensitive company announcements or qualitative material. Simply Wall St has no position in any stocks mentioned.
About TSE:2307
Cross Cat
An information services company, provides system solutions and staffing services in the financial, credit, public, telecom, manufacturing, retail, and other sectors.
Flawless balance sheet, good value and pays a dividend.
Similar Companies
Market Insights

Advertisement
Community Narratives
MicroVision will explode future revenue by 380.37% with a vision towards success
Fair Value US$60|98.4% undervalued
TH
Community Contributor
The Indispensable Artery for a New North American Economy
Fair Value CA$132.87|1.6% undervalued
TI
Community Contributor
Recently Updated Narratives
BE


Bejgal on MINISO Group Holding ·
MINISO's fair value is projected at 26.69 with an anticipated PE ratio shift of 20x
Fair Value:US$26.6928.0% undervalued
44 followersusers have followed this narrative
3 commentsusers have commented on this narrative
0 likesusers have liked this narrative
TI


TickerTickle on Oracle ·
The Quiet Giant That Became AI’s Power Grid
Fair Value:US$389.8149.5% undervalued
7 followersusers have followed this narrative
1 commentusers have commented on this narrative
0 likesusers have liked this narrative
AU

AuCA on Nova Ljubljanska Banka d.d ·
Nova Ljubljanska Banka d.d will expect a 11.2% revenue boost driving future growth
Fair Value:€20916.5% undervalued
23 followersusers have followed this narrative
3 commentsusers have commented on this narrative
0 likesusers have liked this narrative
Popular Narratives
OS


oscargarcia on Alphabet ·
The company that turned a verb into a global necessity and basically runs the modern internet, digital ads, smartphones, maps, and AI.
Fair Value:US$3404.9% undervalued
136 followersusers have followed this narrative
6 commentsusers have commented on this narrative
18 likesusers have liked this narrative
TH

TheWallstreetKing on MicroVision ·
MicroVision will explode future revenue by 380.37% with a vision towards success
Fair Value:US$6098.4% undervalued
88 followersusers have followed this narrative
11 commentsusers have commented on this narrative
18 likesusers have liked this narrative
AN


AnalystConsensusTarget on NVIDIA ·
NVDA: Expanding AI Demand Will Drive Major Data Center Investments Through 2026
Fair Value:US$232.7923.6% undervalued
925 followersusers have followed this narrative
6 commentsusers have commented on this narrative
22 likesusers have liked this narrative