
Advertisement
Japan Third Party Co., Ltd. (TYO:2488) On An Uptrend: Could Fundamentals Be Driving The Stock?
Japan Third Party's (TYO:2488) stock is up by 1.6% over the past month. As most would know, long-term fundamentals have a strong correlation with market price movements, so we decided to look at the company's key financial indicators today to determine if they have any role to play in the recent price movement. Particularly, we will be paying attention to Japan Third Party's ROE today.
Return on equity or ROE is an important factor to be considered by a shareholder because it tells them how effectively their capital is being reinvested. In short, ROE shows the profit each dollar generates with respect to its shareholder investments.
View our latest analysis for Japan Third Party
How Do You Calculate Return On Equity?
The formula for ROE is:
Return on Equity = Net Profit (from continuing operations) ÷ Shareholders' Equity
So, based on the above formula, the ROE for Japan Third Party is:
8.3% = JP¥197m ÷ JP¥2.4b (Based on the trailing twelve months to September 2020).
The 'return' is the amount earned after tax over the last twelve months. That means that for every ¥1 worth of shareholders' equity, the company generated ¥0.08 in profit.
Why Is ROE Important For Earnings Growth?
We have already established that ROE serves as an efficient profit-generating gauge for a company's future earnings. Based on how much of its profits the company chooses to reinvest or "retain", we are then able to evaluate a company's future ability to generate profits. Generally speaking, other things being equal, firms with a high return on equity and profit retention, have a higher growth rate than firms that don’t share these attributes.
Japan Third Party's Earnings Growth And 8.3% ROE
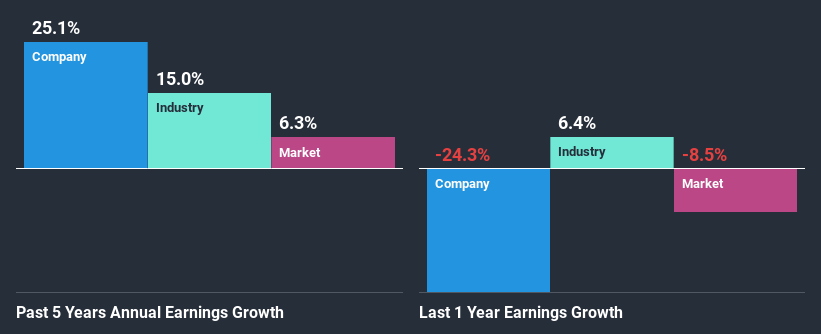
At first glance, Japan Third Party seems to have a decent ROE. Be that as it may, the company's ROE is still quite lower than the industry average of 12%. Still, we can see that Japan Third Party has seen a remarkable net income growth of 25% over the past five years. Therefore, there could be other causes behind this growth. For example, it is possible that the company's management has made some good strategic decisions, or that the company has a low payout ratio. However, not to forget, the company does have a decent ROE to begin with, just that it is lower than the industry average. So this certainly also provides some context to the high earnings growth seen by the company.
As a next step, we compared Japan Third Party's net income growth with the industry, and pleasingly, we found that the growth seen by the company is higher than the average industry growth of 15%.
Earnings growth is a huge factor in stock valuation. What investors need to determine next is if the expected earnings growth, or the lack of it, is already built into the share price. This then helps them determine if the stock is placed for a bright or bleak future. One good indicator of expected earnings growth is the P/E ratio which determines the price the market is willing to pay for a stock based on its earnings prospects. So, you may want to check if Japan Third Party is trading on a high P/E or a low P/E, relative to its industry.
Is Japan Third Party Efficiently Re-investing Its Profits?
Japan Third Party's significant three-year median payout ratio of 55% (where it is retaining only 45% of its income) suggests that the company has been able to achieve a high growth in earnings despite returning most of its income to shareholders.
Additionally, Japan Third Party has paid dividends over a period of at least ten years which means that the company is pretty serious about sharing its profits with shareholders.
Conclusion
On the whole, we do feel that Japan Third Party has some positive attributes. Especially the substantial growth in earnings backed by a decent ROE. Despite the company reinvesting only a small portion of its profits, it still has managed to grow its earnings so that is appreciable. Until now, we have only just grazed the surface of the company's past performance by looking at the company's fundamentals. You can do your own research on Japan Third Party and see how it has performed in the past by looking at this FREE detailed graph of past earnings, revenue and cash flows.
If you decide to trade Japan Third Party, use the lowest-cost* platform that is rated #1 Overall by Barron’s, Interactive Brokers. Trade stocks, options, futures, forex, bonds and funds on 135 markets, all from a single integrated account. Promoted
New: Manage All Your Stock Portfolios in One Place
We've created the ultimate portfolio companion for stock investors, and it's free.
• Connect an unlimited number of Portfolios and see your total in one currency
• Be alerted to new Warning Signs or Risks via email or mobile
• Track the Fair Value of your stocks
This article by Simply Wall St is general in nature. It does not constitute a recommendation to buy or sell any stock, and does not take account of your objectives, or your financial situation. We aim to bring you long-term focused analysis driven by fundamental data. Note that our analysis may not factor in the latest price-sensitive company announcements or qualitative material. Simply Wall St has no position in any stocks mentioned.
*Interactive Brokers Rated Lowest Cost Broker by StockBrokers.com Annual Online Review 2020
Have feedback on this article? Concerned about the content? Get in touch with us directly. Alternatively, email editorial-team@simplywallst.com.
About TSE:2488
JTPLtd
Provides outsourced technical services to technology companies in Japan.
Low risk unattractive dividend payer.
Market Insights

Advertisement
Community Narratives
MINISO's fair value is projected at 26.69 with an anticipated PE ratio shift of 20x
Fair Value US$24.03|11.0% undervalued
BE
Community Contributor
Procter & Gamble: A Dividend Giant Facing Slowing Growth
Fair Value US$119.81|23.3% overvalued
AN
Community Contributor
Eli Lilly's Future Growth Driven by Tirzepatide and Favorable Market Conditions
Fair Value US$1.19k|13.8% undervalued
EA
Community Contributor