Advertisement
- Japan
- /
- Semiconductors
- /
- TSE:7735
Does SCREEN Holdings Still Have Room to Grow After a 42% Surge in 2024?

Simply Wall St
Reviewed by Bailey Pemberton
Thinking about what to do with SCREEN Holdings? You’re not alone. Whether you’re a longtime investor riding the stock’s record run or someone eyeing the meteoric 436.9% five-year return, it’s clear this company has been on a roll. The last year alone saw the share price surge 42.3%, while even in the past month, SCREEN Holdings gained 2.6%. However, it did give back a modest 1.6% in the last week. These numbers hint at underlying momentum, mixed with a dash of short-term volatility.
Much of the optimism can be traced to growing demand in key markets SCREEN serves, lifting sentiment around future growth prospects. Of course, with this kind of track record, the question on everyone’s mind is whether the stock is still undervalued or if its gains have already priced in all the good news.
To answer that, let’s look at SCREEN Holdings’ “valuation score.” Out of six checks that determine whether a company looks undervalued, SCREEN passes four, giving it a value score of 4. This alone suggests there may be some runway left for further upside, but the full picture depends on how you weigh different valuation measures.
Next, I’ll break down the main approaches investors use to judge value, covering where SCREEN stands on each. If you really want to understand what makes valuation meaningful, stick around for the conclusion, where I’ll introduce a smarter way to think about what the stock is truly worth.
Why SCREEN Holdings is lagging behind its peers
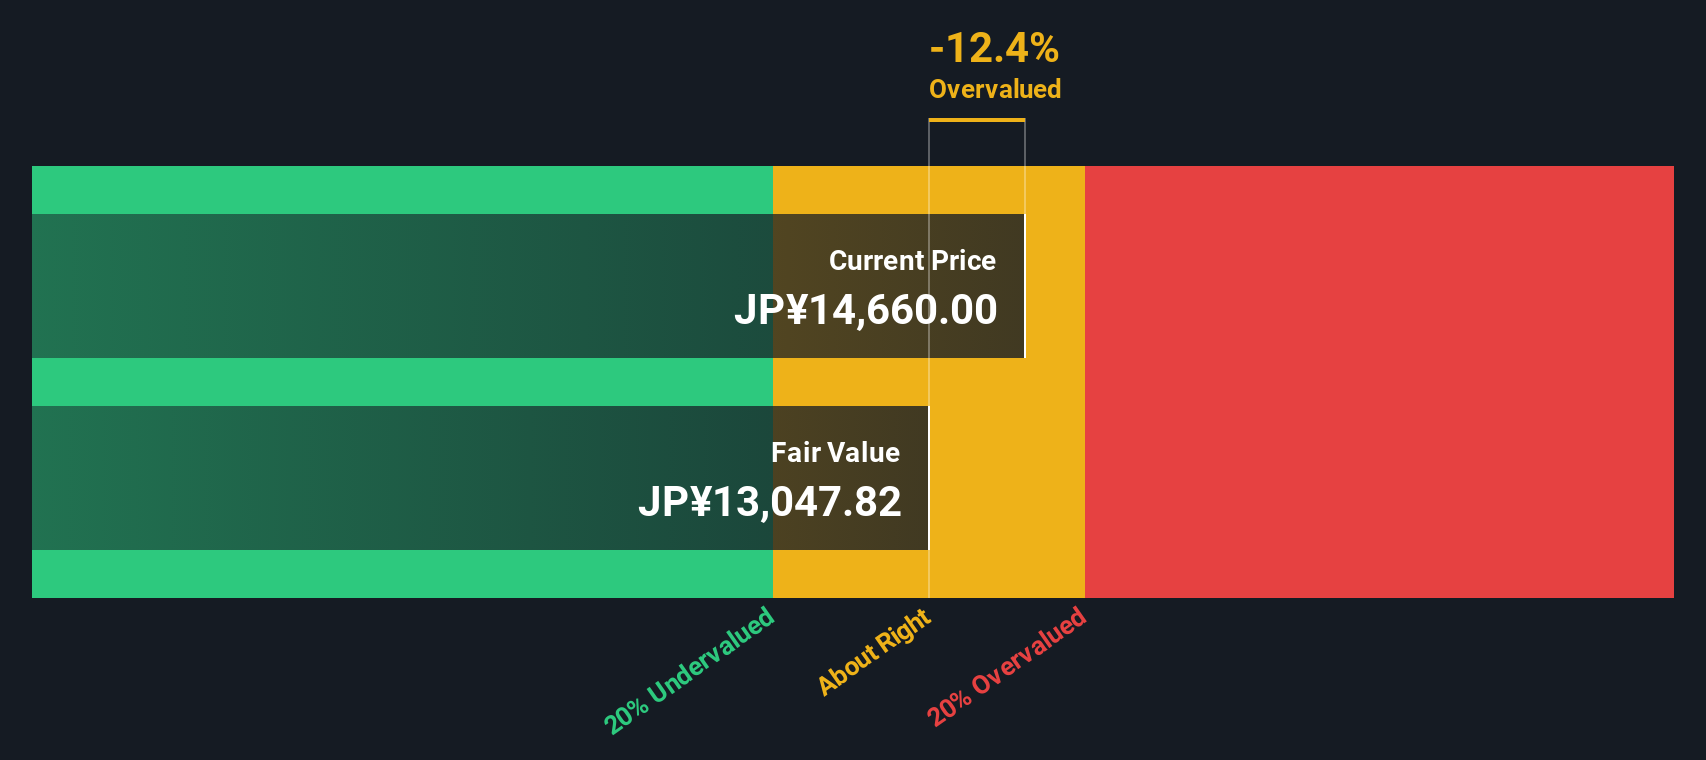
Approach 1: SCREEN Holdings Discounted Cash Flow (DCF) Analysis
The Discounted Cash Flow (DCF) model estimates a company's true worth by projecting future cash flows and discounting them back to their value in today’s terms. This approach helps evaluate whether SCREEN Holdings’ current share price reflects its long-term earning power.
For SCREEN Holdings, the latest reported Free Cash Flow stands at ¥75.3 billion. Analysts anticipate steady growth, with estimates climbing to ¥105.7 billion by the fiscal year ending March 2030. While analyst forecasts only reach five years ahead, further projections up to ten years are generated by Simply Wall St to present a complete picture. This allows for a robust projection, even for years where data relies on reasonable extrapolation rather than direct analyst input.
The DCF model indicates an intrinsic value of ¥14,487 per share. Compared to the current price, this means the stock trades at a modest 6.1% discount to its estimated fair value, signaling that shares are nearly in line with what the underlying business is worth today.
Result: ABOUT RIGHT
Simply Wall St performs a valuation analysis on every stock in the world every day (check out SCREEN Holdings's valuation analysis). We show the entire calculation in full. You can track the result in your watchlist or portfolio and be alerted when this changes.
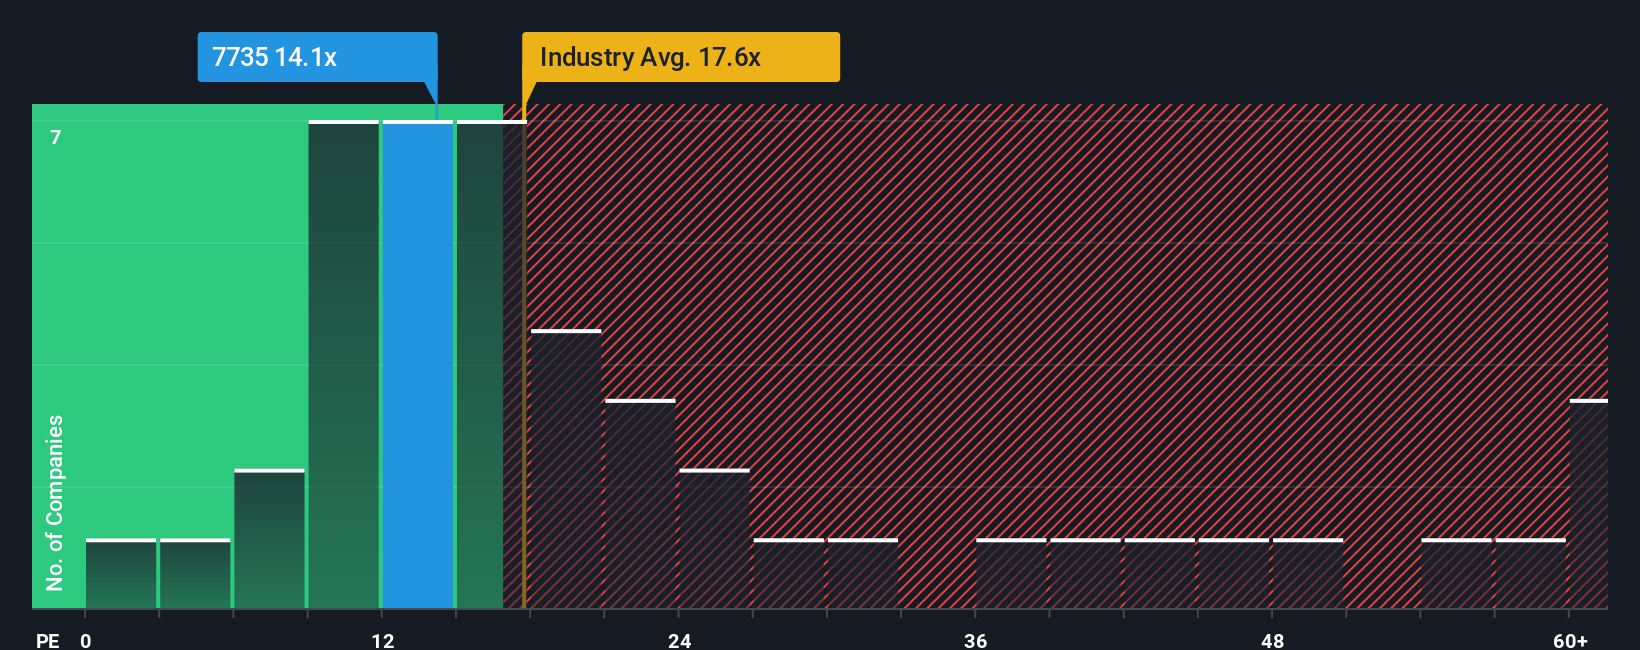
Approach 2: SCREEN Holdings Price vs Earnings
The Price-to-Earnings (PE) ratio is one of the most widely used metrics for valuing profitable companies. It measures how much investors are willing to pay per yen of earnings and is especially useful for companies like SCREEN Holdings with a consistent track record of profitability.
The "right" PE ratio for any company depends on its growth prospects, profitability, and risks within its industry. Higher expected growth or lower risk can justify a loftier PE. In contrast, slower growth or higher risks typically lead to a lower fair multiple.
Currently, SCREEN Holdings trades at a PE of 13.1x. This is below both the semiconductor industry average of 18.2x and the peer group average of 33.8x. At first glance, this suggests SCREEN is valued more conservatively than many competitors. However, raw comparisons can be misleading if they ignore company-specific strengths or risks.
To address this, Simply Wall St calculates a "Fair Ratio." This is a tailored multiple that reflects SCREEN’s unique combination of earnings growth, profit margins, industry factors, company size, and risk profile. Unlike simple industry or peer averages, the Fair Ratio provides a more precise measure of where the company should logically trade. For SCREEN Holdings, the Fair Ratio is 20.7x.
Since the actual PE of 13.1x is below the Fair Ratio of 20.7x, this suggests the shares are valued attractively relative to their underlying fundamentals.
Result: UNDERVALUED
PE ratios tell one story, but what if the real opportunity lies elsewhere? Discover companies where insiders are betting big on explosive growth.
Upgrade Your Decision Making: Choose your SCREEN Holdings Narrative
Earlier we mentioned that there is an even better way to understand valuation, so let’s introduce you to Narratives. A Narrative is your personal investment story that connects what you believe about a company, such as SCREEN Holdings’ future growth, risks, and competitive edge, to the financial forecasts and the fair value you assign.
Rather than relying on a single fair value or just industry comparisons, Narratives let you combine your perspective with key estimates, like revenue growth or profit margins, creating a living forecast supported by your own assumptions. This approach links a company’s business story directly to its numbers, so you can easily see how changes in your outlook impact the price you think is fair.
Narratives are available to everyone on Simply Wall St’s Community page, used by millions of investors worldwide. They help you make smarter buy or sell decisions by showing how your Fair Value compares with the current Price. No complex spreadsheets needed. When big news breaks or results are announced, Narratives update automatically, keeping your view in sync with what matters most.
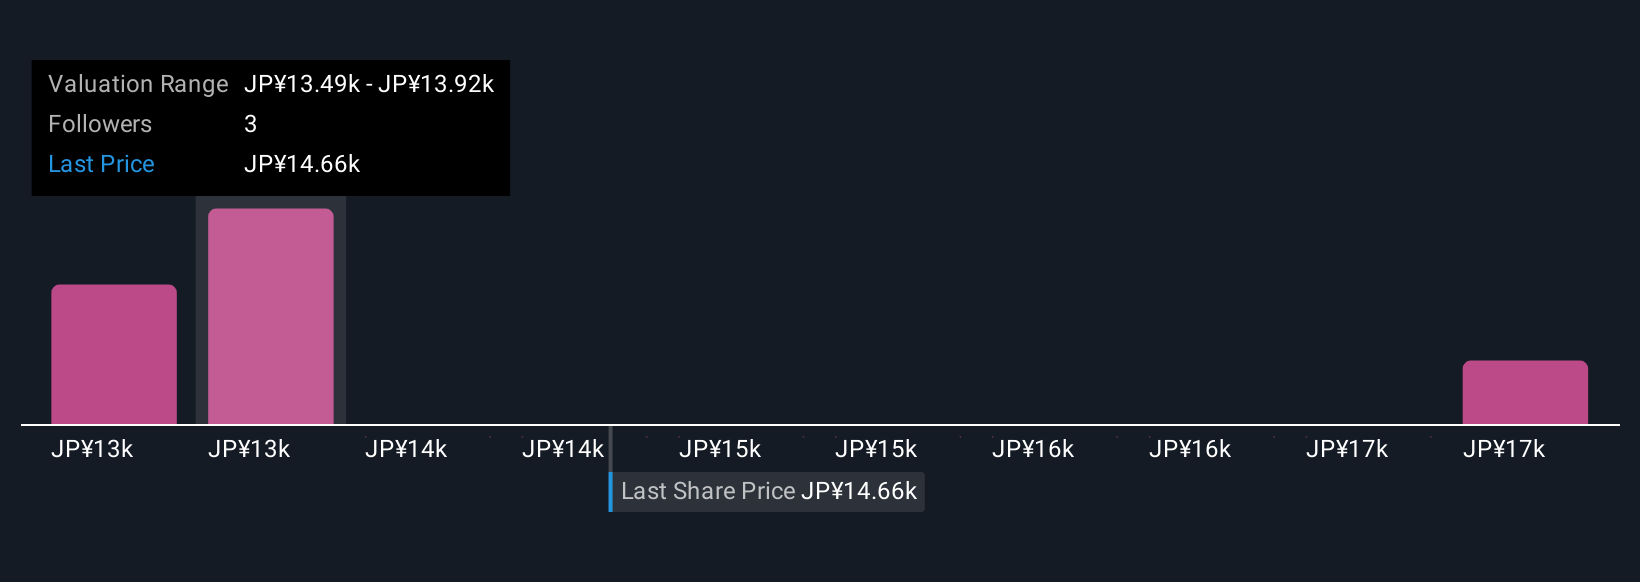
For example, some SCREEN Holdings investors are bullish and set their fair value as high as ¥17,800, reflecting belief in strong AI-driven demand and margin growth, while others are more cautious, with targets as low as ¥11,500 due to concerns over China exposure and industry volatility.
Do you think there's more to the story for SCREEN Holdings? Create your own Narrative to let the Community know!
This article by Simply Wall St is general in nature. We provide commentary based on historical data and analyst forecasts only using an unbiased methodology and our articles are not intended to be financial advice. It does not constitute a recommendation to buy or sell any stock, and does not take account of your objectives, or your financial situation. We aim to bring you long-term focused analysis driven by fundamental data. Note that our analysis may not factor in the latest price-sensitive company announcements or qualitative material. Simply Wall St has no position in any stocks mentioned.
New: Manage All Your Stock Portfolios in One Place
We've created the ultimate portfolio companion for stock investors, and it's free.
• Connect an unlimited number of Portfolios and see your total in one currency
• Be alerted to new Warning Signs or Risks via email or mobile
• Track the Fair Value of your stocks
Have feedback on this article? Concerned about the content? Get in touch with us directly. Alternatively, email editorial-team@simplywallst.com
About TSE:7735
SCREEN Holdings
Develops, manufactures, and markets semiconductor production equipment in Japan, Taiwan, South Korea, China, the United States, Europe, and internationally.
Flawless balance sheet, good value and pays a dividend.
Similar Companies
Market Insights

Advertisement
Community Narratives
MINISO's fair value is projected at 26.69 with an anticipated PE ratio shift of 20x
Fair Value US$24.03|11.0% undervalued
BE
Community Contributor
Procter & Gamble: A Dividend Giant Facing Slowing Growth
Fair Value US$119.81|23.3% overvalued
AN
Community Contributor
Eli Lilly's Future Growth Driven by Tirzepatide and Favorable Market Conditions
Fair Value US$1.19k|13.8% undervalued
EA
Community Contributor