
Advertisement
Howard Marks put it nicely when he said that, rather than worrying about share price volatility, 'The possibility of permanent loss is the risk I worry about... and every practical investor I know worries about.' When we think about how risky a company is, we always like to look at its use of debt, since debt overload can lead to ruin. We can see that Inter Action Corporation (TSE:7725) does use debt in its business. But the real question is whether this debt is making the company risky.
What Risk Does Debt Bring?
Generally speaking, debt only becomes a real problem when a company can't easily pay it off, either by raising capital or with its own cash flow. In the worst case scenario, a company can go bankrupt if it cannot pay its creditors. However, a more usual (but still expensive) situation is where a company must dilute shareholders at a cheap share price simply to get debt under control. By replacing dilution, though, debt can be an extremely good tool for businesses that need capital to invest in growth at high rates of return. The first thing to do when considering how much debt a business uses is to look at its cash and debt together.
Check out our latest analysis for Inter Action
What Is Inter Action's Debt?
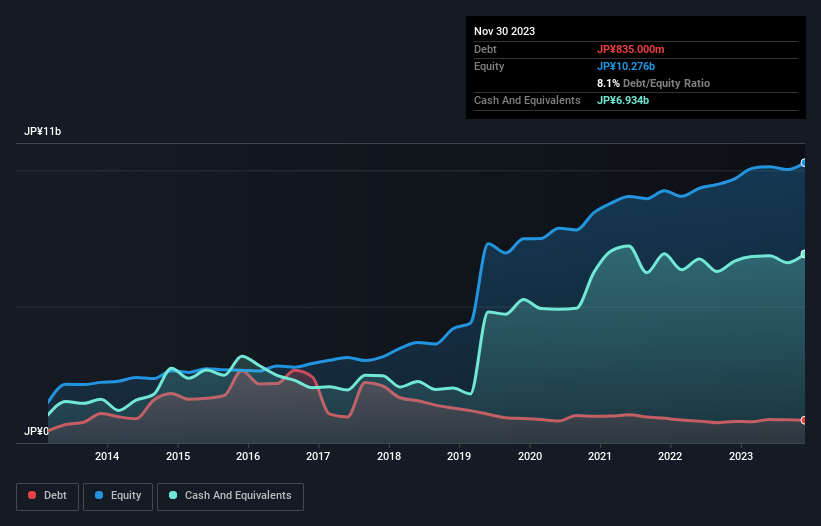
The image below, which you can click on for greater detail, shows that at November 2023 Inter Action had debt of JP¥835.0m, up from JP¥792.0m in one year. But on the other hand it also has JP¥6.93b in cash, leading to a JP¥6.10b net cash position.
A Look At Inter Action's Liabilities
According to the last reported balance sheet, Inter Action had liabilities of JP¥1.64b due within 12 months, and liabilities of JP¥483.0m due beyond 12 months. On the other hand, it had cash of JP¥6.93b and JP¥1.40b worth of receivables due within a year. So it actually has JP¥6.21b more liquid assets than total liabilities.
This excess liquidity is a great indication that Inter Action's balance sheet is almost as strong as Fort Knox. On this view, lenders should feel as safe as the beloved of a black-belt karate master. Simply put, the fact that Inter Action has more cash than debt is arguably a good indication that it can manage its debt safely.
Fortunately, Inter Action grew its EBIT by 6.7% in the last year, making that debt load look even more manageable. There's no doubt that we learn most about debt from the balance sheet. But ultimately the future profitability of the business will decide if Inter Action can strengthen its balance sheet over time. So if you're focused on the future you can check out this free report showing analyst profit forecasts.
Finally, a company can only pay off debt with cold hard cash, not accounting profits. While Inter Action has net cash on its balance sheet, it's still worth taking a look at its ability to convert earnings before interest and tax (EBIT) to free cash flow, to help us understand how quickly it is building (or eroding) that cash balance. Looking at the most recent three years, Inter Action recorded free cash flow of 48% of its EBIT, which is weaker than we'd expect. That weak cash conversion makes it more difficult to handle indebtedness.
Summing Up
While we empathize with investors who find debt concerning, you should keep in mind that Inter Action has net cash of JP¥6.10b, as well as more liquid assets than liabilities. On top of that, it increased its EBIT by 6.7% in the last twelve months. So is Inter Action's debt a risk? It doesn't seem so to us. There's no doubt that we learn most about debt from the balance sheet. However, not all investment risk resides within the balance sheet - far from it. These risks can be hard to spot. Every company has them, and we've spotted 2 warning signs for Inter Action you should know about.
At the end of the day, it's often better to focus on companies that are free from net debt. You can access our special list of such companies (all with a track record of profit growth). It's free.
New: AI Stock Screener & Alerts
Our new AI Stock Screener scans the market every day to uncover opportunities.
• Dividend Powerhouses (3%+ Yield)
• Undervalued Small Caps with Insider Buying
• High growth Tech and AI Companies
Or build your own from over 50 metrics.
Have feedback on this article? Concerned about the content? Get in touch with us directly. Alternatively, email editorial-team (at) simplywallst.com.
This article by Simply Wall St is general in nature. We provide commentary based on historical data and analyst forecasts only using an unbiased methodology and our articles are not intended to be financial advice. It does not constitute a recommendation to buy or sell any stock, and does not take account of your objectives, or your financial situation. We aim to bring you long-term focused analysis driven by fundamental data. Note that our analysis may not factor in the latest price-sensitive company announcements or qualitative material. Simply Wall St has no position in any stocks mentioned.
About TSE:7725
Inter Action
Engages in the develops, manufactures, and sells inspection illuminators for applications in imaging semiconductors manufacturing processes in Japan.
Flawless balance sheet with moderate growth potential.
Market Insights

Advertisement
Community Narratives
MicroVision will explode future revenue by 380.37% with a vision towards success
Fair Value US$60.00|98.4% undervalued
TH
Community Contributor
The Indispensable Artery for a New North American Economy
Fair Value CA$132.87|1.3% undervalued
TI
Community Contributor