
Advertisement
David Iben put it well when he said, 'Volatility is not a risk we care about. What we care about is avoiding the permanent loss of capital.' When we think about how risky a company is, we always like to look at its use of debt, since debt overload can lead to ruin. As with many other companies SAMCO Inc. (TSE:6387) makes use of debt. But the real question is whether this debt is making the company risky.
When Is Debt A Problem?
Debt and other liabilities become risky for a business when it cannot easily fulfill those obligations, either with free cash flow or by raising capital at an attractive price. Ultimately, if the company can't fulfill its legal obligations to repay debt, shareholders could walk away with nothing. However, a more frequent (but still costly) occurrence is where a company must issue shares at bargain-basement prices, permanently diluting shareholders, just to shore up its balance sheet. Having said that, the most common situation is where a company manages its debt reasonably well - and to its own advantage. When we think about a company's use of debt, we first look at cash and debt together.
View our latest analysis for SAMCO
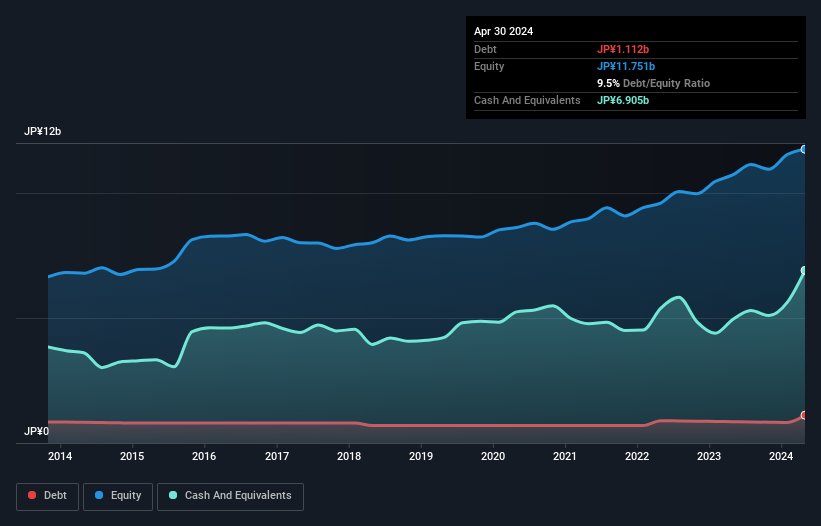
What Is SAMCO's Debt?
You can click the graphic below for the historical numbers, but it shows that as of April 2024 SAMCO had JP¥1.11b of debt, an increase on JP¥852.0m, over one year. However, it does have JP¥6.91b in cash offsetting this, leading to net cash of JP¥5.79b.
How Healthy Is SAMCO's Balance Sheet?
According to the last reported balance sheet, SAMCO had liabilities of JP¥3.15b due within 12 months, and liabilities of JP¥966.0m due beyond 12 months. On the other hand, it had cash of JP¥6.91b and JP¥1.65b worth of receivables due within a year. So it can boast JP¥4.44b more liquid assets than total liabilities.
This excess liquidity suggests that SAMCO is taking a careful approach to debt. Because it has plenty of assets, it is unlikely to have trouble with its lenders. Succinctly put, SAMCO boasts net cash, so it's fair to say it does not have a heavy debt load!
On the other hand, SAMCO saw its EBIT drop by 4.7% in the last twelve months. If earnings continue to decline at that rate the company may have increasing difficulty managing its debt load. The balance sheet is clearly the area to focus on when you are analysing debt. But ultimately the future profitability of the business will decide if SAMCO can strengthen its balance sheet over time. So if you want to see what the professionals think, you might find this free report on analyst profit forecasts to be interesting.
Finally, a company can only pay off debt with cold hard cash, not accounting profits. SAMCO may have net cash on the balance sheet, but it is still interesting to look at how well the business converts its earnings before interest and tax (EBIT) to free cash flow, because that will influence both its need for, and its capacity to manage debt. Looking at the most recent three years, SAMCO recorded free cash flow of 35% of its EBIT, which is weaker than we'd expect. That weak cash conversion makes it more difficult to handle indebtedness.
Summing Up
While we empathize with investors who find debt concerning, you should keep in mind that SAMCO has net cash of JP¥5.79b, as well as more liquid assets than liabilities. So we don't have any problem with SAMCO's use of debt. There's no doubt that we learn most about debt from the balance sheet. However, not all investment risk resides within the balance sheet - far from it. These risks can be hard to spot. Every company has them, and we've spotted 1 warning sign for SAMCO you should know about.
Of course, if you're the type of investor who prefers buying stocks without the burden of debt, then don't hesitate to discover our exclusive list of net cash growth stocks, today.
New: Manage All Your Stock Portfolios in One Place
We've created the ultimate portfolio companion for stock investors, and it's free.
• Connect an unlimited number of Portfolios and see your total in one currency
• Be alerted to new Warning Signs or Risks via email or mobile
• Track the Fair Value of your stocks
Have feedback on this article? Concerned about the content? Get in touch with us directly. Alternatively, email editorial-team (at) simplywallst.com.
This article by Simply Wall St is general in nature. We provide commentary based on historical data and analyst forecasts only using an unbiased methodology and our articles are not intended to be financial advice. It does not constitute a recommendation to buy or sell any stock, and does not take account of your objectives, or your financial situation. We aim to bring you long-term focused analysis driven by fundamental data. Note that our analysis may not factor in the latest price-sensitive company announcements or qualitative material. Simply Wall St has no position in any stocks mentioned.
Have feedback on this article? Concerned about the content? Get in touch with us directly. Alternatively, email editorial-team@simplywallst.com
About TSE:6387
Excellent balance sheet with proven track record.
Market Insights

Advertisement
Community Narratives
MINISO's fair value is projected at 26.69 with an anticipated PE ratio shift of 20x
Fair Value US$24.03|11.0% undervalued
BE
Community Contributor
Procter & Gamble: A Dividend Giant Facing Slowing Growth
Fair Value US$119.81|23.3% overvalued
AN
Community Contributor
Eli Lilly's Future Growth Driven by Tirzepatide and Favorable Market Conditions
Fair Value US$1.19k|13.8% undervalued
EA
Community Contributor