
Advertisement
Finding a business that has the potential to grow substantially is not easy, but it is possible if we look at a few key financial metrics. In a perfect world, we'd like to see a company investing more capital into its business and ideally the returns earned from that capital are also increasing. Put simply, these types of businesses are compounding machines, meaning they are continually reinvesting their earnings at ever-higher rates of return. So when we looked at the ROCE trend of Abalance (TSE:3856) we really liked what we saw.
What Is Return On Capital Employed (ROCE)?
For those that aren't sure what ROCE is, it measures the amount of pre-tax profits a company can generate from the capital employed in its business. Analysts use this formula to calculate it for Abalance:
Return on Capital Employed = Earnings Before Interest and Tax (EBIT) ÷ (Total Assets - Current Liabilities)
0.33 = JP¥18b ÷ (JP¥149b - JP¥94b) (Based on the trailing twelve months to December 2023).
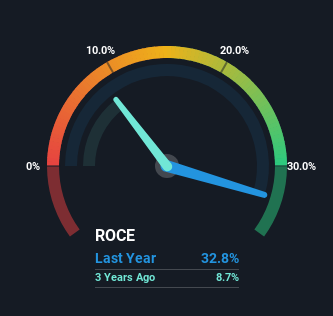
Therefore, Abalance has an ROCE of 33%. That's a fantastic return and not only that, it outpaces the average of 12% earned by companies in a similar industry.
Check out our latest analysis for Abalance
While the past is not representative of the future, it can be helpful to know how a company has performed historically, which is why we have this chart above. If you'd like to look at how Abalance has performed in the past in other metrics, you can view this free graph of Abalance's past earnings, revenue and cash flow.
So How Is Abalance's ROCE Trending?
The trends we've noticed at Abalance are quite reassuring. Over the last five years, returns on capital employed have risen substantially to 33%. The amount of capital employed has increased too, by 964%. The increasing returns on a growing amount of capital is common amongst multi-baggers and that's why we're impressed.
For the record though, there was a noticeable increase in the company's current liabilities over the period, so we would attribute some of the ROCE growth to that. Effectively this means that suppliers or short-term creditors are now funding 63% of the business, which is more than it was five years ago. Given it's pretty high ratio, we'd remind investors that having current liabilities at those levels can bring about some risks in certain businesses.
What We Can Learn From Abalance's ROCE
To sum it up, Abalance has proven it can reinvest in the business and generate higher returns on that capital employed, which is terrific. Since the stock has returned a staggering 1,135% to shareholders over the last five years, it looks like investors are recognizing these changes. In light of that, we think it's worth looking further into this stock because if Abalance can keep these trends up, it could have a bright future ahead.
Abalance does come with some risks though, we found 2 warning signs in our investment analysis, and 1 of those is potentially serious...
If you'd like to see other companies earning high returns, check out our free list of companies earning high returns with solid balance sheets here.
New: Manage All Your Stock Portfolios in One Place
We've created the ultimate portfolio companion for stock investors, and it's free.
• Connect an unlimited number of Portfolios and see your total in one currency
• Be alerted to new Warning Signs or Risks via email or mobile
• Track the Fair Value of your stocks
Have feedback on this article? Concerned about the content? Get in touch with us directly. Alternatively, email editorial-team (at) simplywallst.com.
This article by Simply Wall St is general in nature. We provide commentary based on historical data and analyst forecasts only using an unbiased methodology and our articles are not intended to be financial advice. It does not constitute a recommendation to buy or sell any stock, and does not take account of your objectives, or your financial situation. We aim to bring you long-term focused analysis driven by fundamental data. Note that our analysis may not factor in the latest price-sensitive company announcements or qualitative material. Simply Wall St has no position in any stocks mentioned.
About TSE:3856
Abalance
Engages in renewable energy, construction machinery, IT, and photocatalyst businesses in Japan.
Excellent balance sheet with slight risk.
Market Insights

Advertisement
Community Narratives
MINISO's fair value is projected at 26.69 with an anticipated PE ratio shift of 20x
Fair Value US$24.03|11.0% undervalued
BE
Community Contributor
Procter & Gamble: A Dividend Giant Facing Slowing Growth
Fair Value US$119.81|23.3% overvalued
AN
Community Contributor
Eli Lilly's Future Growth Driven by Tirzepatide and Favorable Market Conditions
Fair Value US$1.19k|13.8% undervalued
EA
Community Contributor