Advertisement
Pan Pacific International Holdings (TSE:7532): Evaluating Valuation After Strong October Sales Growth

Simply Wall St
Reviewed by Simply Wall St
Pan Pacific International Holdings (TSE:7532) just published its October sales update, highlighting steady year-over-year growth in both its discount store and UNY business segments. Investors are watching the sustainability of these sales figures moving forward.
See our latest analysis for Pan Pacific International Holdings.
Pan Pacific International Holdings has caught investors’ attention with its consistent sales growth, even as the share price slipped over the past quarter. Despite a recent dip, the stock boasts a 1-year total shareholder return of 23.4% and a remarkable 92% return over both three and five years. This suggests that momentum remains solid over the long term.
If you’re tracking retailers with standout multi-year performance, it may be a good time to broaden your perspective and explore fast growing stocks with high insider ownership
With shares trading about 23% below analyst price targets and strong sales momentum in recent results, investors may wonder whether Pan Pacific International Holdings is overlooked by the market, or if all the upward potential is already factored into today’s price.
Price-to-Earnings of 27.9x: Is it justified?
Pan Pacific International Holdings trades at a price-to-earnings (P/E) ratio of 27.9x, putting it at a premium versus key benchmarks. The last close price was ¥918.9, which indicates that the market attaches a much higher earnings multiple to this stock than to many of its competitors.
The price-to-earnings ratio measures what investors are willing to pay today for a single yen of profits generated by the company. For retail businesses, it is a commonly used yardstick for comparing valuations between peers and against the market's expectations for future growth and profitability.
Pan Pacific’s P/E ratio is notably higher than both the Multiline Retail industry average (15.9x) and its peer group (19.4x). In addition, the current P/E stands above the estimated fair P/E ratio of 23.2x, which suggests the stock could trade lower if the market were to adjust to a more typical valuation level.
Explore the SWS fair ratio for Pan Pacific International Holdings
Result: Price-to-Earnings of 27.9x (OVERVALUED)
However, softening revenue growth or a shift in market sentiment could challenge the premium valuation that investors are currently willing to pay.
Find out about the key risks to this Pan Pacific International Holdings narrative.
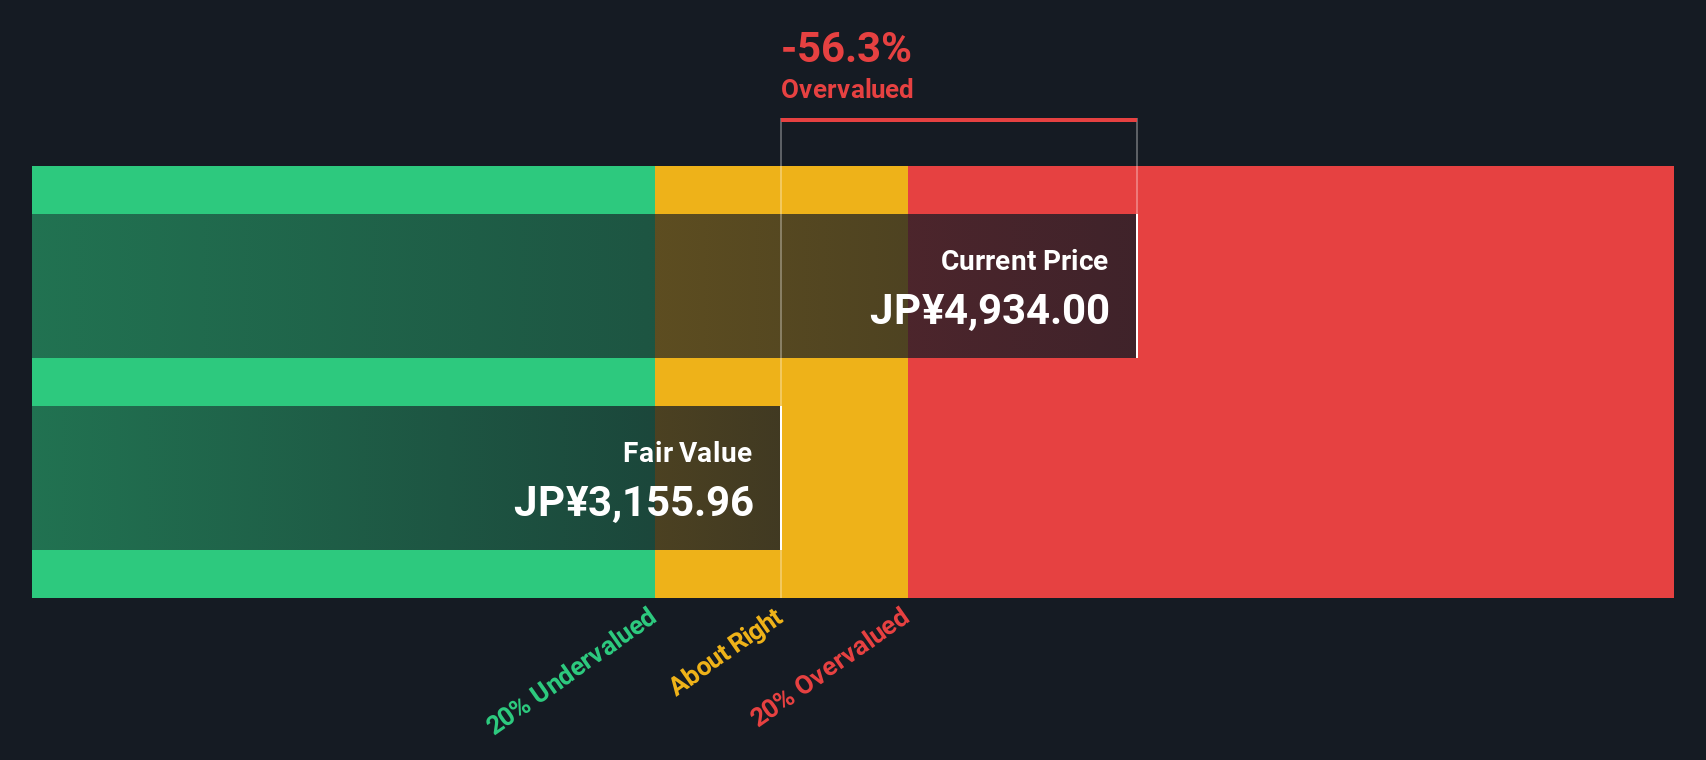
Another View: Discounted Cash Flow Perspective
Taking a step back from earnings multiples, our DCF model suggests a very different outlook. Based on projected future cash flows, Pan Pacific International Holdings’ share price of ¥918.9 is significantly above its fair value estimate of ¥640.27. This indicates the stock may be overvalued by this approach. Does this challenge the optimism implied by analyst targets?
Look into how the SWS DCF model arrives at its fair value.
Simply Wall St performs a discounted cash flow (DCF) on every stock in the world every day (check out Pan Pacific International Holdings for example). We show the entire calculation in full. You can track the result in your watchlist or portfolio and be alerted when this changes, or use our stock screener to discover 894 undervalued stocks based on their cash flows. If you save a screener we even alert you when new companies match - so you never miss a potential opportunity.
Build Your Own Pan Pacific International Holdings Narrative
If you have a different perspective or want to dig deeper into the numbers, you can quickly create your own view of the story in just a few minutes. Do it your way
A good starting point is our analysis highlighting 3 key rewards investors are optimistic about regarding Pan Pacific International Holdings.
Looking for more investment ideas?
Smart moves today can open the door to tomorrow’s breakthroughs. Don’t miss your opportunity. Filter top stocks and find your edge with the Simply Wall Street Screener.
- Secure potential long-term income streams by reviewing these 18 dividend stocks with yields > 3% with yields above 3% and robust payout histories.
- Start building your portfolio for tomorrow by tracking these 27 AI penny stocks driving artificial intelligence innovation across industries.
- Capture hidden bargains easily when you assess these 894 undervalued stocks based on cash flows priced below intrinsic value and backed by strong fundamentals.
This article by Simply Wall St is general in nature. We provide commentary based on historical data and analyst forecasts only using an unbiased methodology and our articles are not intended to be financial advice. It does not constitute a recommendation to buy or sell any stock, and does not take account of your objectives, or your financial situation. We aim to bring you long-term focused analysis driven by fundamental data. Note that our analysis may not factor in the latest price-sensitive company announcements or qualitative material. Simply Wall St has no position in any stocks mentioned.
New: Manage All Your Stock Portfolios in One Place
We've created the ultimate portfolio companion for stock investors, and it's free.
• Connect an unlimited number of Portfolios and see your total in one currency
• Be alerted to new Warning Signs or Risks via email or mobile
• Track the Fair Value of your stocks
Have feedback on this article? Concerned about the content? Get in touch with us directly. Alternatively, email editorial-team@simplywallst.com
About TSE:7532
Flawless balance sheet with solid track record.
Similar Companies
Market Insights

Advertisement
Community Narratives
MINISO's fair value is projected at 26.69 with an anticipated PE ratio shift of 20x
Fair Value US$24.03|12.0% undervalued
BE
Community Contributor
Procter & Gamble: A Dividend Giant Facing Slowing Growth
Fair Value US$119.81|21.7% overvalued
AN
Community Contributor
Eli Lilly's Future Growth Driven by Tirzepatide and Favorable Market Conditions
Fair Value US$1.19k|14.1% undervalued
EA
Community Contributor