Advertisement
- Japan
- /
- Specialty Stores
- /
- TSE:7419
Undiscovered Gems In Asia For February 2025

Simply Wall St
Reviewed by Simply Wall St
Amidst a backdrop of geopolitical tensions and fluctuating market sentiment, the Asian markets have shown resilience, particularly with China's tech sector experiencing notable gains. As investors navigate this complex landscape, identifying stocks that demonstrate strong fundamentals and growth potential can be crucial for capitalizing on opportunities in the region's dynamic markets.
Top 10 Undiscovered Gems With Strong Fundamentals In Asia
| Name | Debt To Equity | Revenue Growth | Earnings Growth | Health Rating |
|---|---|---|---|---|
| Cresco | 6.02% | 8.43% | 10.37% | ★★★★★★ |
| Toho | 69.92% | 3.85% | 59.41% | ★★★★★★ |
| Sinopower Semiconductor | 7.69% | 3.39% | 0.02% | ★★★★★★ |
| Pan Asian Microvent Tech (Jiangsu) | 20.39% | 14.25% | 10.66% | ★★★★★★ |
| AIC | 23.80% | 25.41% | 61.47% | ★★★★★★ |
| Techshine ElectronicsLtd | NA | 15.38% | 17.24% | ★★★★★★ |
| Renxin New MaterialLtd | NA | 0.65% | -39.64% | ★★★★★★ |
| YagiLtd | 38.98% | -8.93% | 16.36% | ★★★★★☆ |
| Shenzhen Keanda Electronic Technology | 5.01% | -5.04% | -11.56% | ★★★★★☆ |
| Nippon Sharyo | 59.09% | -1.22% | -12.92% | ★★★★☆☆ |
We'll examine a selection from our screener results.
Beijing Tricolor Technology (SHSE:603516)
Simply Wall St Value Rating: ★★★★★★
Overview: Beijing Tricolor Technology Co., Ltd specializes in the manufacturing and sale of professional audio and video products on a global scale, with a market capitalization of approximately CN¥11.65 billion.
Operations: Tricolor's primary revenue stream comes from the display control industry, generating approximately CN¥484.76 million. The company has a market capitalization of about CN¥11.65 billion.
Beijing Tricolor Technology, a small player in the electronics industry, has shown impressive earnings growth of 188% over the past year, significantly outpacing the sector's 1.6% increase. The company operates debt-free and boasts high-quality earnings, contributing to its robust financial health. While Tricolor's share price has been volatile recently, it remains free cash flow positive with a recent levered free cash flow of US$33.56 million as of September 2024. Looking ahead, its forecasted annual earnings growth rate of approximately 49% suggests potential for continued expansion in this competitive market space.
Global Infotech (SZSE:300465)
Simply Wall St Value Rating: ★★★★☆☆
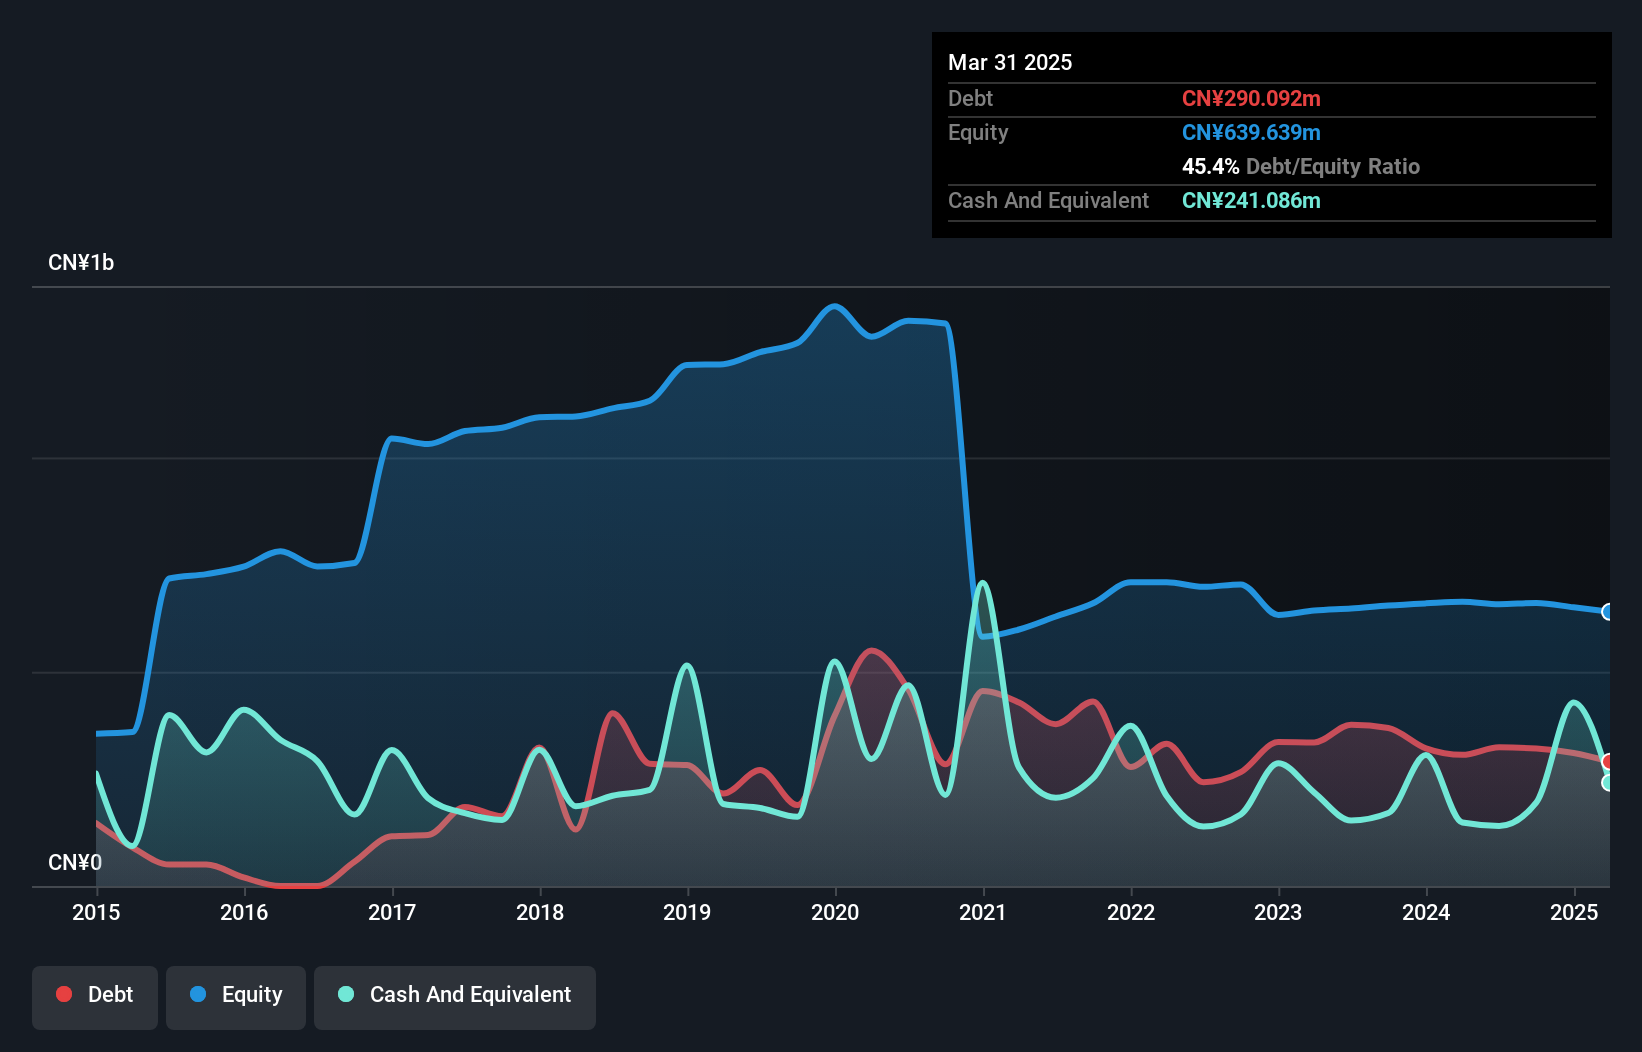
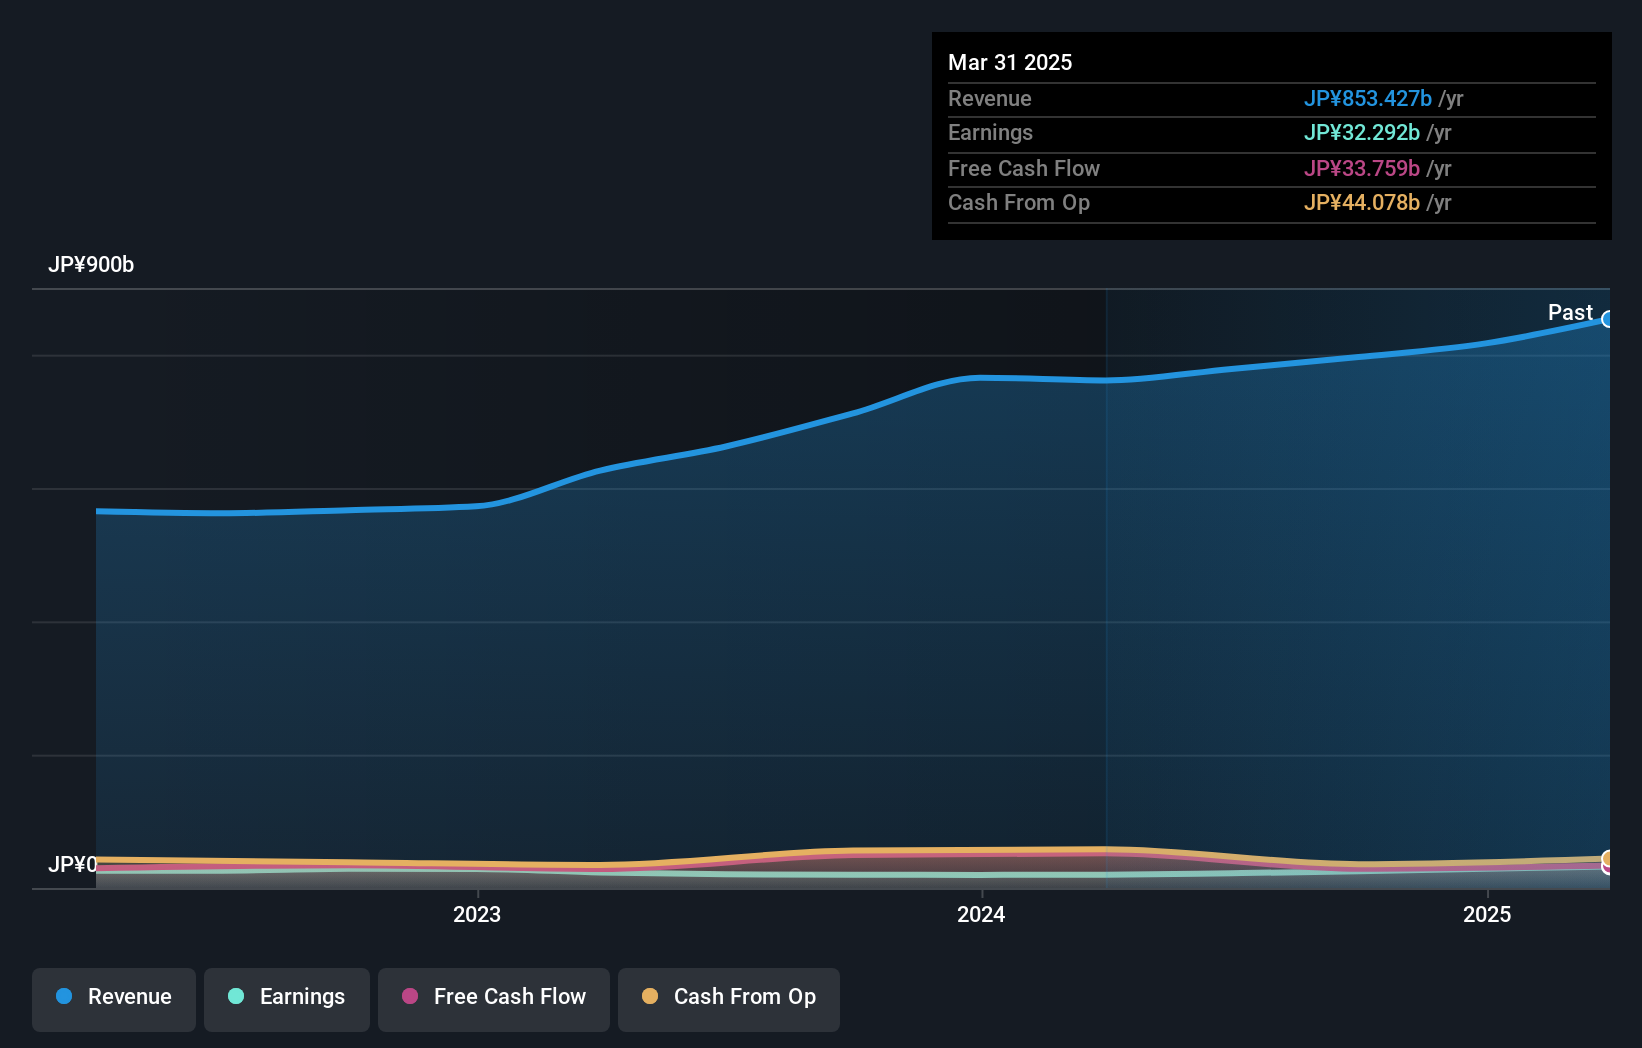
Overview: Global Infotech Co., Ltd. offers financial information products and integrated services in China, with a market cap of CN¥8.61 billion.
Operations: Global Infotech generates revenue primarily from financial information products and integrated services within China. The company has a market capitalization of CN¥8.61 billion.
Global Infotech, a promising tech player in Asia, has seen its debt to equity ratio jump from 14.9% to 48.6% over five years, yet it maintains a satisfactory net debt to equity ratio of 19%. The company recently turned profitable and outpaced the software industry's average growth rate of -10.9%, showcasing its robust performance trajectory. Despite high volatility in share price over the last three months, Global Infotech boasts high-quality earnings and positive free cash flow. However, interest coverage remains tight with EBIT covering interest payments only 2.5 times, indicating room for improvement in financial stability.
- Navigate through the intricacies of Global Infotech with our comprehensive health report here.
Gain insights into Global Infotech's past trends and performance with our Past report.
Nojima (TSE:7419)
Simply Wall St Value Rating: ★★★★★★
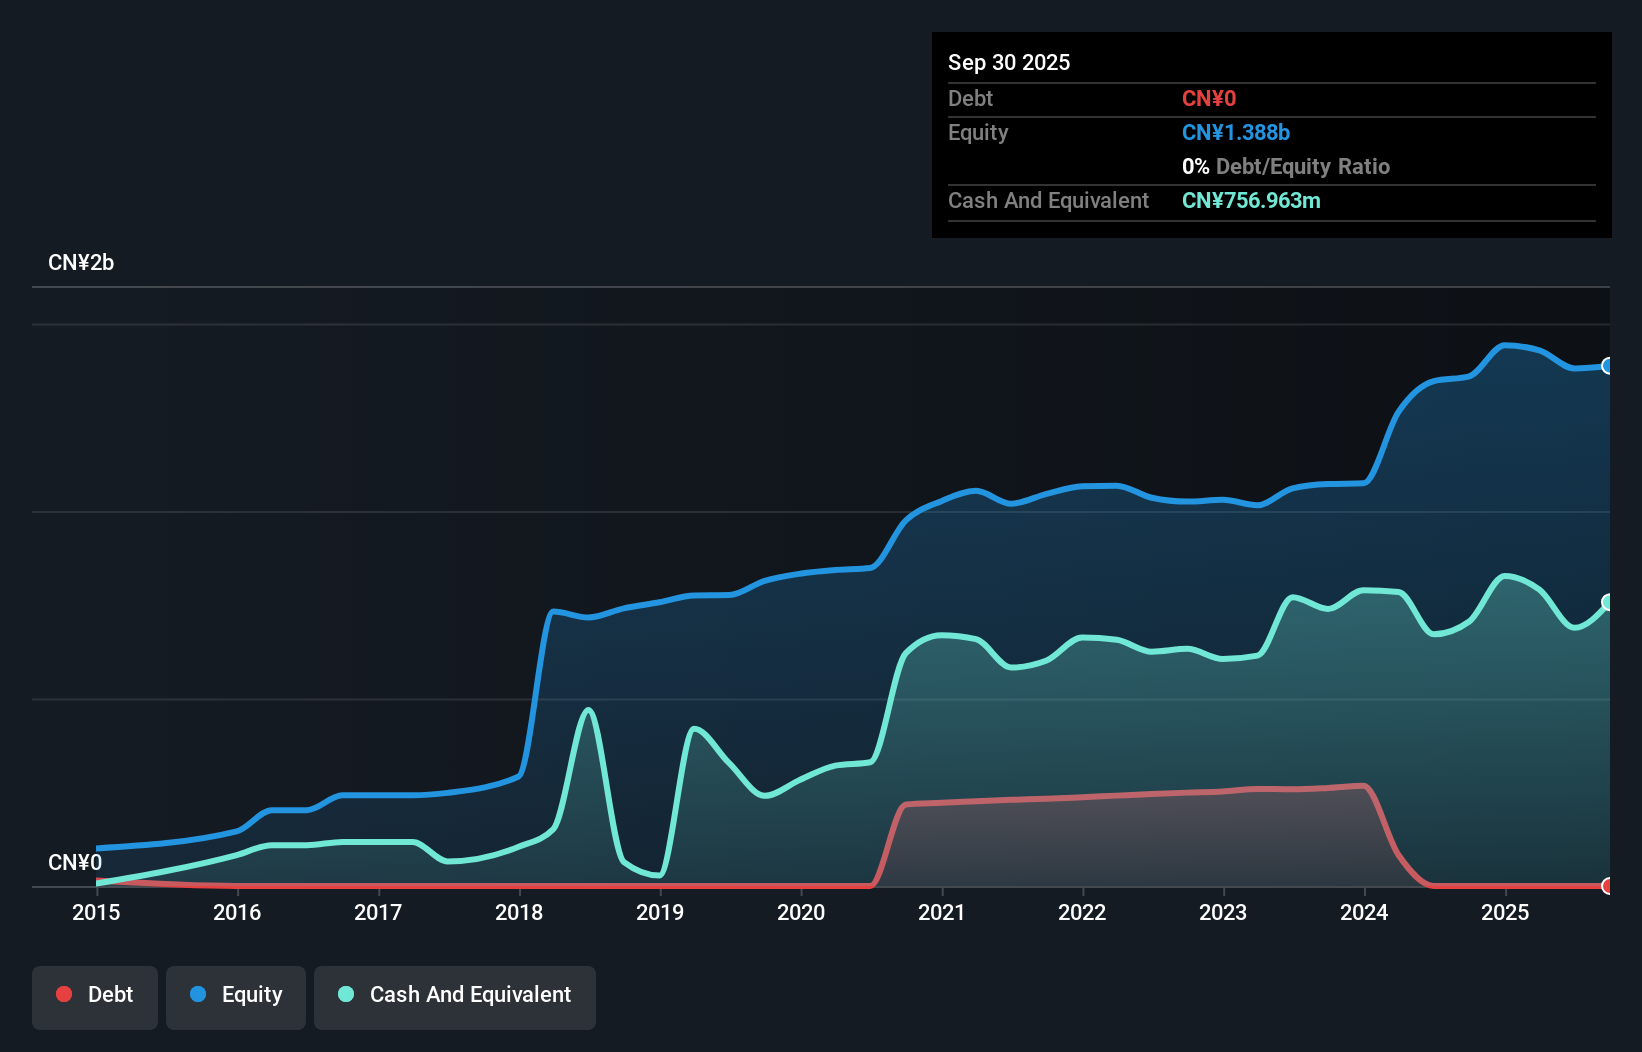
Overview: Nojima Corporation operates digital home electronics retail stores both in Japan and internationally, with a market cap of approximately ¥228.72 billion.
Operations: The company generates revenue primarily through its digital home electronics retail stores. It has a market capitalization of approximately ¥228.72 billion.
Nojima, a notable player in the Specialty Retail sector, has shown impressive financial health with its earnings growing 46.6% over the past year, outpacing the industry's 9.5%. The company boasts a strong balance sheet, having reduced its debt-to-equity ratio from 81.6% to 34% over five years and holding more cash than total debt. Despite a historical decline of 7.4% in earnings per year over five years, Nojima trades at an attractive valuation—54.4% below its estimated fair value—and maintains high-quality earnings with robust interest coverage of 145x EBIT to interest payments.
- Unlock comprehensive insights into our analysis of Nojima stock in this health report.
Understand Nojima's track record by examining our Past report.
Make It Happen
- Explore the 2558 names from our Asian Undiscovered Gems With Strong Fundamentals screener here.
- Have you diversified into these companies? Leverage the power of Simply Wall St's portfolio to keep a close eye on market movements affecting your investments.
- Join a community of smart investors by using Simply Wall St. It's free and delivers expert-level analysis on worldwide markets.
Interested In Other Possibilities?
- Explore high-performing small cap companies that haven't yet garnered significant analyst attention.
- Fuel your portfolio with companies showing strong growth potential, backed by optimistic outlooks both from analysts and management.
- Find companies with promising cash flow potential yet trading below their fair value.
This article by Simply Wall St is general in nature. We provide commentary based on historical data and analyst forecasts only using an unbiased methodology and our articles are not intended to be financial advice. It does not constitute a recommendation to buy or sell any stock, and does not take account of your objectives, or your financial situation. We aim to bring you long-term focused analysis driven by fundamental data. Note that our analysis may not factor in the latest price-sensitive company announcements or qualitative material. Simply Wall St has no position in any stocks mentioned.
Valuation is complex, but we're here to simplify it.
Discover if Nojima might be undervalued or overvalued with our detailed analysis, featuring fair value estimates, potential risks, dividends, insider trades, and its financial condition.
Access Free AnalysisHave feedback on this article? Concerned about the content? Get in touch with us directly. Alternatively, email editorial-team@simplywallst.com
About TSE:7419
Nojima
Operates digital home electronics retail stores in Japan and internationally.
Flawless balance sheet, good value and pays a dividend.
Market Insights

Advertisement
Community Narratives
MINISO's fair value is projected at 26.69 with an anticipated PE ratio shift of 20x
Fair Value US$24.03|11.0% undervalued
BE
Community Contributor
Procter & Gamble: A Dividend Giant Facing Slowing Growth
Fair Value US$119.81|23.3% overvalued
AN
Community Contributor
Eli Lilly's Future Growth Driven by Tirzepatide and Favorable Market Conditions
Fair Value US$1.19k|13.8% undervalued
EA
Community Contributor