
Advertisement
More Unpleasant Surprises Could Be In Store For Path Corporation's (TSE:3840) Shares After Tumbling 28%
Path Corporation (TSE:3840) shareholders that were waiting for something to happen have been dealt a blow with a 28% share price drop in the last month. The recent drop has obliterated the annual return, with the share price now down 9.2% over that longer period.
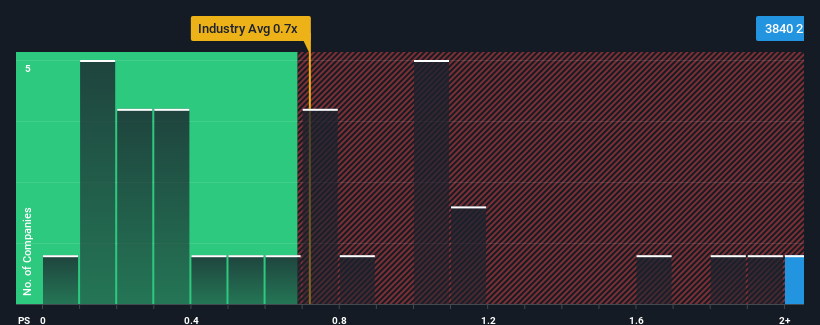
Although its price has dipped substantially, when almost half of the companies in Japan's Multiline Retail industry have price-to-sales ratios (or "P/S") below 0.7x, you may still consider Path as a stock probably not worth researching with its 2.5x P/S ratio. However, the P/S might be high for a reason and it requires further investigation to determine if it's justified.
See our latest analysis for Path
How Path Has Been Performing
Revenue has risen firmly for Path recently, which is pleasing to see. It might be that many expect the respectable revenue performance to beat most other companies over the coming period, which has increased investors’ willingness to pay up for the stock. If not, then existing shareholders may be a little nervous about the viability of the share price.
Although there are no analyst estimates available for Path, take a look at this free data-rich visualisation to see how the company stacks up on earnings, revenue and cash flow.Is There Enough Revenue Growth Forecasted For Path?
In order to justify its P/S ratio, Path would need to produce impressive growth in excess of the industry.
Taking a look back first, we see that the company grew revenue by an impressive 17% last year. As a result, it also grew revenue by 5.1% in total over the last three years. Accordingly, shareholders would have probably been satisfied with the medium-term rates of revenue growth.
This is in contrast to the rest of the industry, which is expected to grow by 7.5% over the next year, materially higher than the company's recent medium-term annualised growth rates.
With this in mind, we find it worrying that Path's P/S exceeds that of its industry peers. It seems most investors are ignoring the fairly limited recent growth rates and are hoping for a turnaround in the company's business prospects. There's a good chance existing shareholders are setting themselves up for future disappointment if the P/S falls to levels more in line with recent growth rates.
The Final Word
Path's P/S remain high even after its stock plunged. Using the price-to-sales ratio alone to determine if you should sell your stock isn't sensible, however it can be a practical guide to the company's future prospects.
The fact that Path currently trades on a higher P/S relative to the industry is an oddity, since its recent three-year growth is lower than the wider industry forecast. When we see slower than industry revenue growth but an elevated P/S, there's considerable risk of the share price declining, sending the P/S lower. Unless there is a significant improvement in the company's medium-term performance, it will be difficult to prevent the P/S ratio from declining to a more reasonable level.
You need to take note of risks, for example - Path has 4 warning signs (and 2 which can't be ignored) we think you should know about.
If these risks are making you reconsider your opinion on Path, explore our interactive list of high quality stocks to get an idea of what else is out there.
New: Manage All Your Stock Portfolios in One Place
We've created the ultimate portfolio companion for stock investors, and it's free.
• Connect an unlimited number of Portfolios and see your total in one currency
• Be alerted to new Warning Signs or Risks via email or mobile
• Track the Fair Value of your stocks
Have feedback on this article? Concerned about the content? Get in touch with us directly. Alternatively, email editorial-team (at) simplywallst.com.
This article by Simply Wall St is general in nature. We provide commentary based on historical data and analyst forecasts only using an unbiased methodology and our articles are not intended to be financial advice. It does not constitute a recommendation to buy or sell any stock, and does not take account of your objectives, or your financial situation. We aim to bring you long-term focused analysis driven by fundamental data. Note that our analysis may not factor in the latest price-sensitive company announcements or qualitative material. Simply Wall St has no position in any stocks mentioned.
About TSE:3840
Excellent balance sheet with low risk.
Market Insights

Advertisement
Community Narratives
MINISO's fair value is projected at 26.69 with an anticipated PE ratio shift of 20x
Fair Value US$24.03|11.0% undervalued
BE
Community Contributor
Procter & Gamble: A Dividend Giant Facing Slowing Growth
Fair Value US$119.81|23.3% overvalued
AN
Community Contributor
Eli Lilly's Future Growth Driven by Tirzepatide and Favorable Market Conditions
Fair Value US$1.19k|13.8% undervalued
EA
Community Contributor