
Advertisement
- Japan
- /
- Specialty Stores
- /
- TSE:3185
Dream Vision Co.,Ltd.'s (TSE:3185) Shares Climb 43% But Its Business Is Yet to Catch Up
Despite an already strong run, Dream Vision Co.,Ltd. (TSE:3185) shares have been powering on, with a gain of 43% in the last thirty days. The last 30 days bring the annual gain to a very sharp 69%.
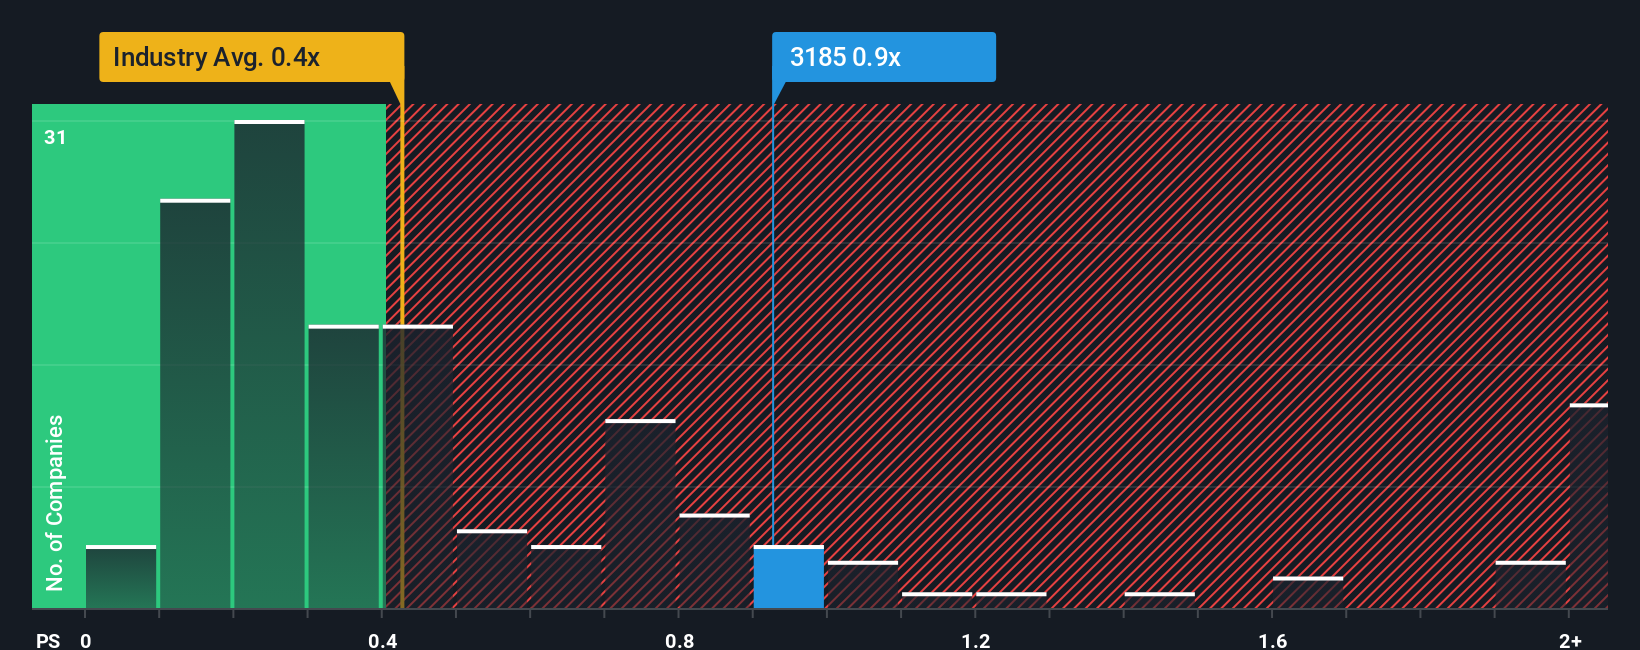
After such a large jump in price, you could be forgiven for thinking Dream VisionLtd is a stock not worth researching with a price-to-sales ratios (or "P/S") of 0.9x, considering almost half the companies in Japan's Specialty Retail industry have P/S ratios below 0.4x. Nonetheless, we'd need to dig a little deeper to determine if there is a rational basis for the elevated P/S.
View our latest analysis for Dream VisionLtd
What Does Dream VisionLtd's Recent Performance Look Like?
For example, consider that Dream VisionLtd's financial performance has been poor lately as its revenue has been in decline. It might be that many expect the company to still outplay most other companies over the coming period, which has kept the P/S from collapsing. You'd really hope so, otherwise you're paying a pretty hefty price for no particular reason.
Although there are no analyst estimates available for Dream VisionLtd, take a look at this free data-rich visualisation to see how the company stacks up on earnings, revenue and cash flow.Is There Enough Revenue Growth Forecasted For Dream VisionLtd?
In order to justify its P/S ratio, Dream VisionLtd would need to produce impressive growth in excess of the industry.
Retrospectively, the last year delivered a frustrating 3.8% decrease to the company's top line. As a result, revenue from three years ago have also fallen 13% overall. Therefore, it's fair to say the revenue growth recently has been undesirable for the company.
Weighing that medium-term revenue trajectory against the broader industry's one-year forecast for expansion of 7.4% shows it's an unpleasant look.
In light of this, it's alarming that Dream VisionLtd's P/S sits above the majority of other companies. It seems most investors are ignoring the recent poor growth rate and are hoping for a turnaround in the company's business prospects. Only the boldest would assume these prices are sustainable as a continuation of recent revenue trends is likely to weigh heavily on the share price eventually.
The Key Takeaway
Dream VisionLtd shares have taken a big step in a northerly direction, but its P/S is elevated as a result. Typically, we'd caution against reading too much into price-to-sales ratios when settling on investment decisions, though it can reveal plenty about what other market participants think about the company.
Our examination of Dream VisionLtd revealed its shrinking revenue over the medium-term isn't resulting in a P/S as low as we expected, given the industry is set to grow. Right now we aren't comfortable with the high P/S as this revenue performance is highly unlikely to support such positive sentiment for long. If recent medium-term revenue trends continue, it will place shareholders' investments at significant risk and potential investors in danger of paying an excessive premium.
You need to take note of risks, for example - Dream VisionLtd has 3 warning signs (and 1 which makes us a bit uncomfortable) we think you should know about.
If you're unsure about the strength of Dream VisionLtd's business, why not explore our interactive list of stocks with solid business fundamentals for some other companies you may have missed.
New: Manage All Your Stock Portfolios in One Place
We've created the ultimate portfolio companion for stock investors, and it's free.
• Connect an unlimited number of Portfolios and see your total in one currency
• Be alerted to new Warning Signs or Risks via email or mobile
• Track the Fair Value of your stocks
Have feedback on this article? Concerned about the content? Get in touch with us directly. Alternatively, email editorial-team (at) simplywallst.com.
This article by Simply Wall St is general in nature. We provide commentary based on historical data and analyst forecasts only using an unbiased methodology and our articles are not intended to be financial advice. It does not constitute a recommendation to buy or sell any stock, and does not take account of your objectives, or your financial situation. We aim to bring you long-term focused analysis driven by fundamental data. Note that our analysis may not factor in the latest price-sensitive company announcements or qualitative material. Simply Wall St has no position in any stocks mentioned.
About TSE:3185
Dream VisionLtd
Engages in the online mail-order sale of clothing, shoes, and other goods in Japan and internationally.
Excellent balance sheet with very low risk.
Market Insights

Advertisement
Community Narratives
MINISO's fair value is projected at 26.69 with an anticipated PE ratio shift of 20x
Fair Value US$24.03|11.0% undervalued
BE
Community Contributor
Procter & Gamble: A Dividend Giant Facing Slowing Growth
Fair Value US$119.81|23.3% overvalued
AN
Community Contributor
Eli Lilly's Future Growth Driven by Tirzepatide and Favorable Market Conditions
Fair Value US$1.19k|13.8% undervalued
EA
Community Contributor