Advertisement
Star Asia Investment (TSE:3468): Valuation Insights After Strong September Hotel Occupancy Results

Simply Wall St
Reviewed by Simply Wall St
Star Asia Investment (TSE:3468) has attracted fresh attention after revealing high occupancy rates across its hotel portfolio for September. The strong operational results suggest an increase in cash flows and improved prospects for future returns for stakeholders.
See our latest analysis for Star Asia Investment.
Momentum has clearly been on Star Asia Investment’s side, with strong hotel occupancy helping to fuel renewed investor interest. This year’s share price return stands at 18.2%. When you factor in dividends, the total shareholder return over the past year jumps to an impressive 28.3%. This suggests that steady cash flow and stable distributions are boosting overall performance far beyond the headline price alone. The refinancing move announced this month appears to have had little impact on results or forecasts, keeping the focus firmly on operational strength in the hospitality space.
If you’re curious about what else is catching momentum, now’s a great opportunity to broaden your search and discover fast growing stocks with high insider ownership
With shares having climbed and operational momentum continuing, investors now face a key question: is the stock still undervalued or has the recent strength already been fully priced in, potentially leaving limited room for additional upside?
Price-to-Earnings of 34.4x: Is It Justified?
Star Asia Investment is currently trading at a price-to-earnings (P/E) ratio of 34.4x, which is significantly higher than both its peer group average of 22x and the broader JP REITs industry average of 20.6x. The last close price stands at ¥61,800, putting the stock well above what peers are commanding for similar earnings power.
The P/E ratio measures how much investors are willing to pay for each unit of current earnings. For real estate investment trusts (REITs) like Star Asia Investment, it provides insight into whether the market expects higher growth, more stable income, or some other catalyst compared to sector peers.
With a P/E far above the sector norm, the valuation signals that the market may be pricing in optimistic future earnings or is rewarding recent operational momentum more than underlying earnings quality. However, recent profitability trends have been negative, and the company has struggled to deliver earnings growth, unlike its industry peers who average double-digit gains.
Compared to its peers and the industry at large, Star Asia Investment appears to be expensive by this metric. Unless future earnings growth or cash flow acceleration materializes soon, the valuation premium could be hard to justify over the longer term.
See what the numbers say about this price — find out in our valuation breakdown.
Result: Price-to-Earnings of 34.4x (OVERVALUED)
However, a reversal in occupancy momentum or weaker-than-expected growth could quickly challenge bullish sentiment and put pressure on the current elevated valuation.
Find out about the key risks to this Star Asia Investment narrative.
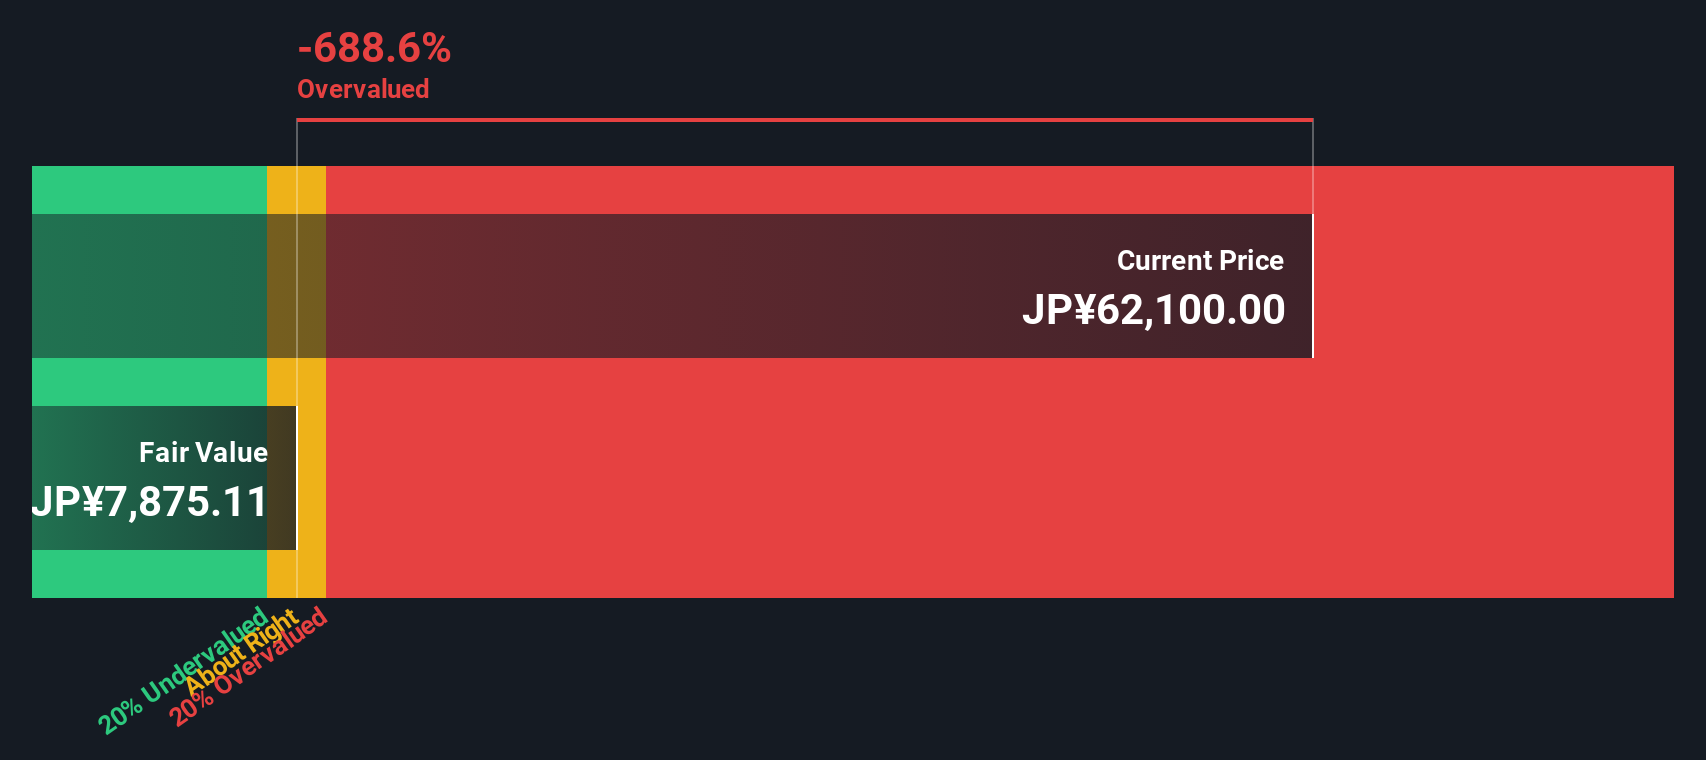
Another View: SWS DCF Model Signals Overvaluation
Taking a different angle, the SWS DCF model values Star Asia Investment at ¥7,436, which is well below today’s price of ¥61,800. This suggests the market is pricing in a much brighter future than long-term cash flows support. Are investors focusing too much on recent momentum and overlooking fundamental value?
Look into how the SWS DCF model arrives at its fair value.
Simply Wall St performs a discounted cash flow (DCF) on every stock in the world every day (check out Star Asia Investment for example). We show the entire calculation in full. You can track the result in your watchlist or portfolio and be alerted when this changes, or use our stock screener to discover undervalued stocks based on their cash flows. If you save a screener we even alert you when new companies match - so you never miss a potential opportunity.
Build Your Own Star Asia Investment Narrative
Readers who want to challenge this perspective or conduct their own research can quickly build an informed view in just a few minutes. Do it your way
A great starting point for your Star Asia Investment research is our analysis highlighting 3 important warning signs that could impact your investment decision.
Ready for More Smart Investment Moves?
Letting opportunities pass you by could be costly. Make your next smart investing decision with the Simply Wall Street Screener and start building an edge today.
- Strengthen your portfolio with steady income by tracking these 19 dividend stocks with yields > 3%, which delivers yields above 3% for more reliable long-term returns.
- Find growth potential you might be overlooking through these 27 AI penny stocks, which fuel tomorrow’s breakthroughs in artificial intelligence and automation.
- Seize undervalued opportunities as soon as they arise by using these 876 undervalued stocks based on cash flows to spot stocks trading below their cash flow worth.
This article by Simply Wall St is general in nature. We provide commentary based on historical data and analyst forecasts only using an unbiased methodology and our articles are not intended to be financial advice. It does not constitute a recommendation to buy or sell any stock, and does not take account of your objectives, or your financial situation. We aim to bring you long-term focused analysis driven by fundamental data. Note that our analysis may not factor in the latest price-sensitive company announcements or qualitative material. Simply Wall St has no position in any stocks mentioned.
New: Manage All Your Stock Portfolios in One Place
We've created the ultimate portfolio companion for stock investors, and it's free.
• Connect an unlimited number of Portfolios and see your total in one currency
• Be alerted to new Warning Signs or Risks via email or mobile
• Track the Fair Value of your stocks
Have feedback on this article? Concerned about the content? Get in touch with us directly. Alternatively, email editorial-team@simplywallst.com
About TSE:3468
Star Asia Investment
Star Asia Investment Corporation (SAR) was established as a diversified real estate investment trust on December 1, 2015, under the Act on Investment Trusts and Investment Corporations (Act No.
Low risk with questionable track record.
Market Insights

Advertisement
Community Narratives
Finding The True Value Of A Logistics Powerhouse
Fair Value US$95.21|8.4% undervalued
NV
Community Contributor
Paradigm Biopharmaceuticals Will Lead Osteoarthritis Treatment with Zilosul's FDA Success
Fair Value AU$5.50|91.9% undervalued
AM
Community Contributor
Barrick Mining (ABX:CA): A Gold Hedge against a U.S. Shutdown
Fair Value CA$60.00|25.8% undervalued
GM
Community Contributor