Advertisement
- Japan
- /
- Real Estate
- /
- TSE:8830
Sumitomo Realty & Development (TSE:8830): Assessing Valuation After Buyback, Dividend Boost, Raised Guidance, and Stock Split

Simply Wall St
Reviewed by Simply Wall St
Sumitomo Realty & Development (TSE:8830) is in the spotlight after announcing a new share repurchase program, an increase in interim dividends, and raising its earnings guidance for the current fiscal year. These moves are expected to benefit shareholders.
See our latest analysis for Sumitomo Realty & Development.
Sumitomo Realty & Development has seen its momentum build over the course of the year, with a 46% share price return year-to-date and a total shareholder return of 56% for the past 12 months. Announcements around a major buyback, higher dividends, raised earnings guidance, and an upcoming stock split have fueled positive sentiment. This has helped to propel the stock even higher as investors respond to both improved shareholder rewards and upbeat growth prospects.
If the recent string of shareholder-friendly moves has you thinking about what other opportunities are out there, now is the perfect moment to check out fast growing stocks with high insider ownership.
The question now is whether Sumitomo Realty & Development’s stock still offers value to new investors, or if recent strong performance means the market has already priced in the company’s brighter outlook and growth prospects.
Price-to-Earnings of 16.7x: Is it justified?
Sumitomo Realty & Development currently trades at a price-to-earnings (P/E) ratio of 16.7x, which stands out as expensive compared to both its industry peers and the broader real estate sector. The last close price was ¥7,190, placing the stock firmly above typical valuation benchmarks for its industry.
The P/E ratio is a measure of what investors are willing to pay today for a yen of current earnings. In the case of real estate companies, this multiple can signal investor expectations about future growth, profitability, and sector health. A higher ratio often implies the market anticipates stronger earnings ahead or believes the company carries lower risk than competitors.
Sumitomo Realty & Development’s 16.7x P/E is notably above the JP Real Estate industry average of 11x and its peer group average of 14.1x. However, when compared to an estimated fair P/E of 18.5x, the market could still move higher towards this level if optimism persists or the company's performance continues to improve.
Explore the SWS fair ratio for Sumitomo Realty & Development
Result: Price-to-Earnings of 16.7x (OVERVALUED)
However, investors should watch for any slowdown in annual revenue or net income growth, as this could challenge the current positive outlook for shares.
Find out about the key risks to this Sumitomo Realty & Development narrative.
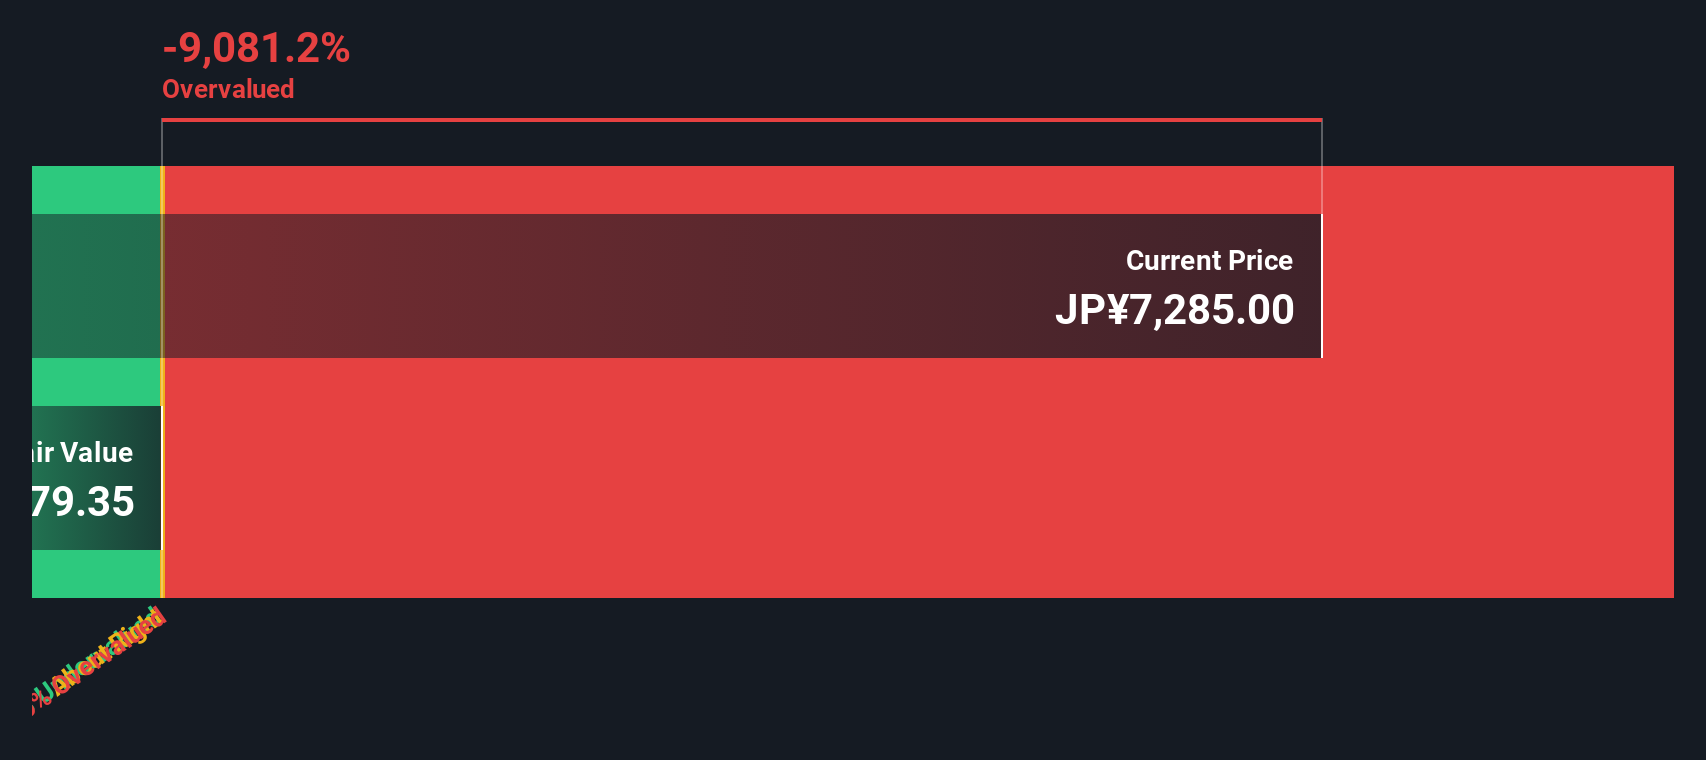
Another View: Discounted Cash Flow Suggests Shares Are Overvalued
While the price-to-earnings discussion paints a bullish picture, the SWS DCF model offers a very different perspective. Based on our calculations, Sumitomo Realty & Development’s shares are trading significantly above our estimate of fair value, which points to a potentially overvalued situation. Which method should investors trust?
Look into how the SWS DCF model arrives at its fair value.
Simply Wall St performs a discounted cash flow (DCF) on every stock in the world every day (check out Sumitomo Realty & Development for example). We show the entire calculation in full. You can track the result in your watchlist or portfolio and be alerted when this changes, or use our stock screener to discover 877 undervalued stocks based on their cash flows. If you save a screener we even alert you when new companies match - so you never miss a potential opportunity.
Build Your Own Sumitomo Realty & Development Narrative
If you have a different perspective or want to dig into the numbers yourself, it’s quick and easy to shape your own take in just a few minutes using our tools. Do it your way
A great starting point for your Sumitomo Realty & Development research is our analysis highlighting 2 key rewards and 1 important warning sign that could impact your investment decision.
Looking for More Smart Investing Ideas?
Set yourself apart from the crowd by using Simply Wall Street’s powerful screeners to find hidden gems, fast-moving trends, and high-yield opportunities before others catch on.
- Catch early momentum by backing companies that offer attractive value with these 877 undervalued stocks based on cash flows, based on robust cash flows and future growth potential.
- Benefit from steady payouts by uncovering income opportunities with these 14 dividend stocks with yields > 3%, which deliver strong yields above 3%.
- Get ahead of financial innovation and rapid disruption by targeting game-changers among these 27 AI penny stocks, set to transform entire industries with artificial intelligence.
This article by Simply Wall St is general in nature. We provide commentary based on historical data and analyst forecasts only using an unbiased methodology and our articles are not intended to be financial advice. It does not constitute a recommendation to buy or sell any stock, and does not take account of your objectives, or your financial situation. We aim to bring you long-term focused analysis driven by fundamental data. Note that our analysis may not factor in the latest price-sensitive company announcements or qualitative material. Simply Wall St has no position in any stocks mentioned.
New: Manage All Your Stock Portfolios in One Place
We've created the ultimate portfolio companion for stock investors, and it's free.
• Connect an unlimited number of Portfolios and see your total in one currency
• Be alerted to new Warning Signs or Risks via email or mobile
• Track the Fair Value of your stocks
Have feedback on this article? Concerned about the content? Get in touch with us directly. Alternatively, email editorial-team@simplywallst.com
About TSE:8830
Sumitomo Realty & Development
Operates as a real estate company in Japan.
Proven track record average dividend payer.
Similar Companies
Market Insights

Advertisement
Community Narratives
MINISO's fair value is projected at 26.69 with an anticipated PE ratio shift of 20x
Fair Value US$24.03|9.0% undervalued
BE
Community Contributor
Procter & Gamble: A Dividend Giant Facing Slowing Growth
Fair Value US$119.81|23.5% overvalued
AN
Community Contributor
Eli Lilly's Future Growth Driven by Tirzepatide and Favorable Market Conditions
Fair Value US$1.19k|14.4% undervalued
EA
Community Contributor